
Researching the
Nasdaq-100.
Develop signals, compare stock strategies and test a portfolio in a research environment.
Academic research only. Commercial use prohibited. User agreement · 中文
Start with a testable idea.
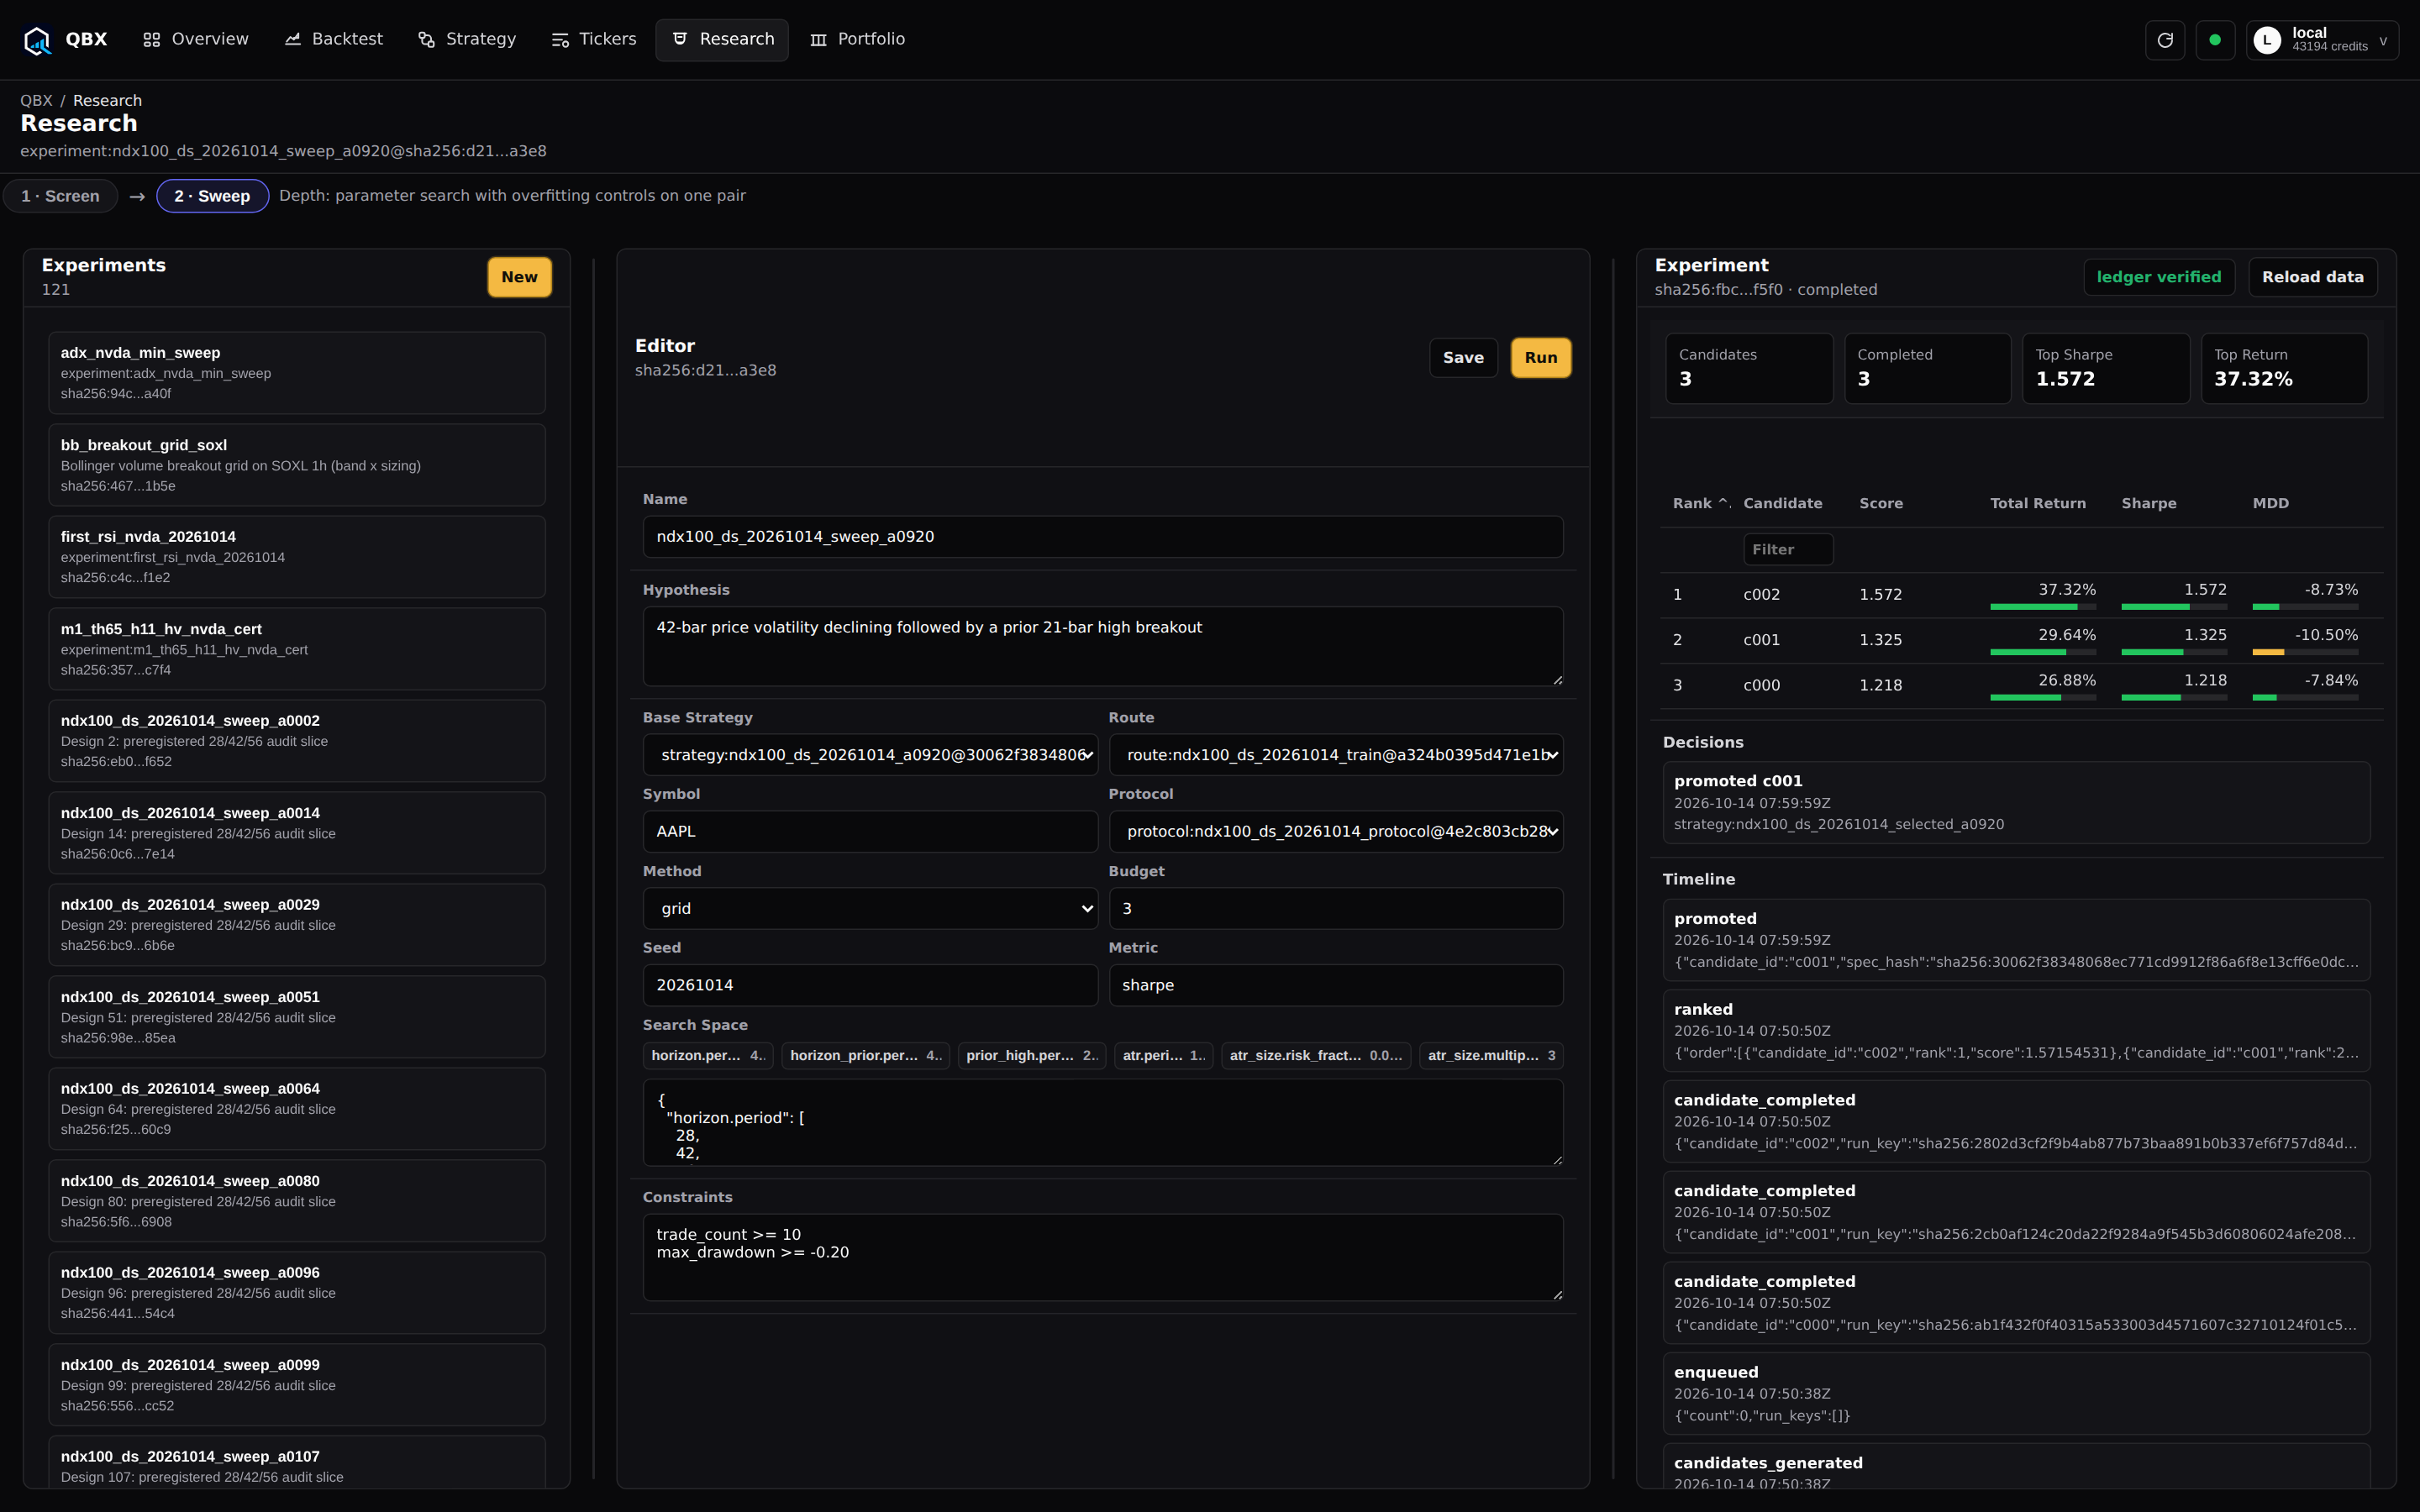
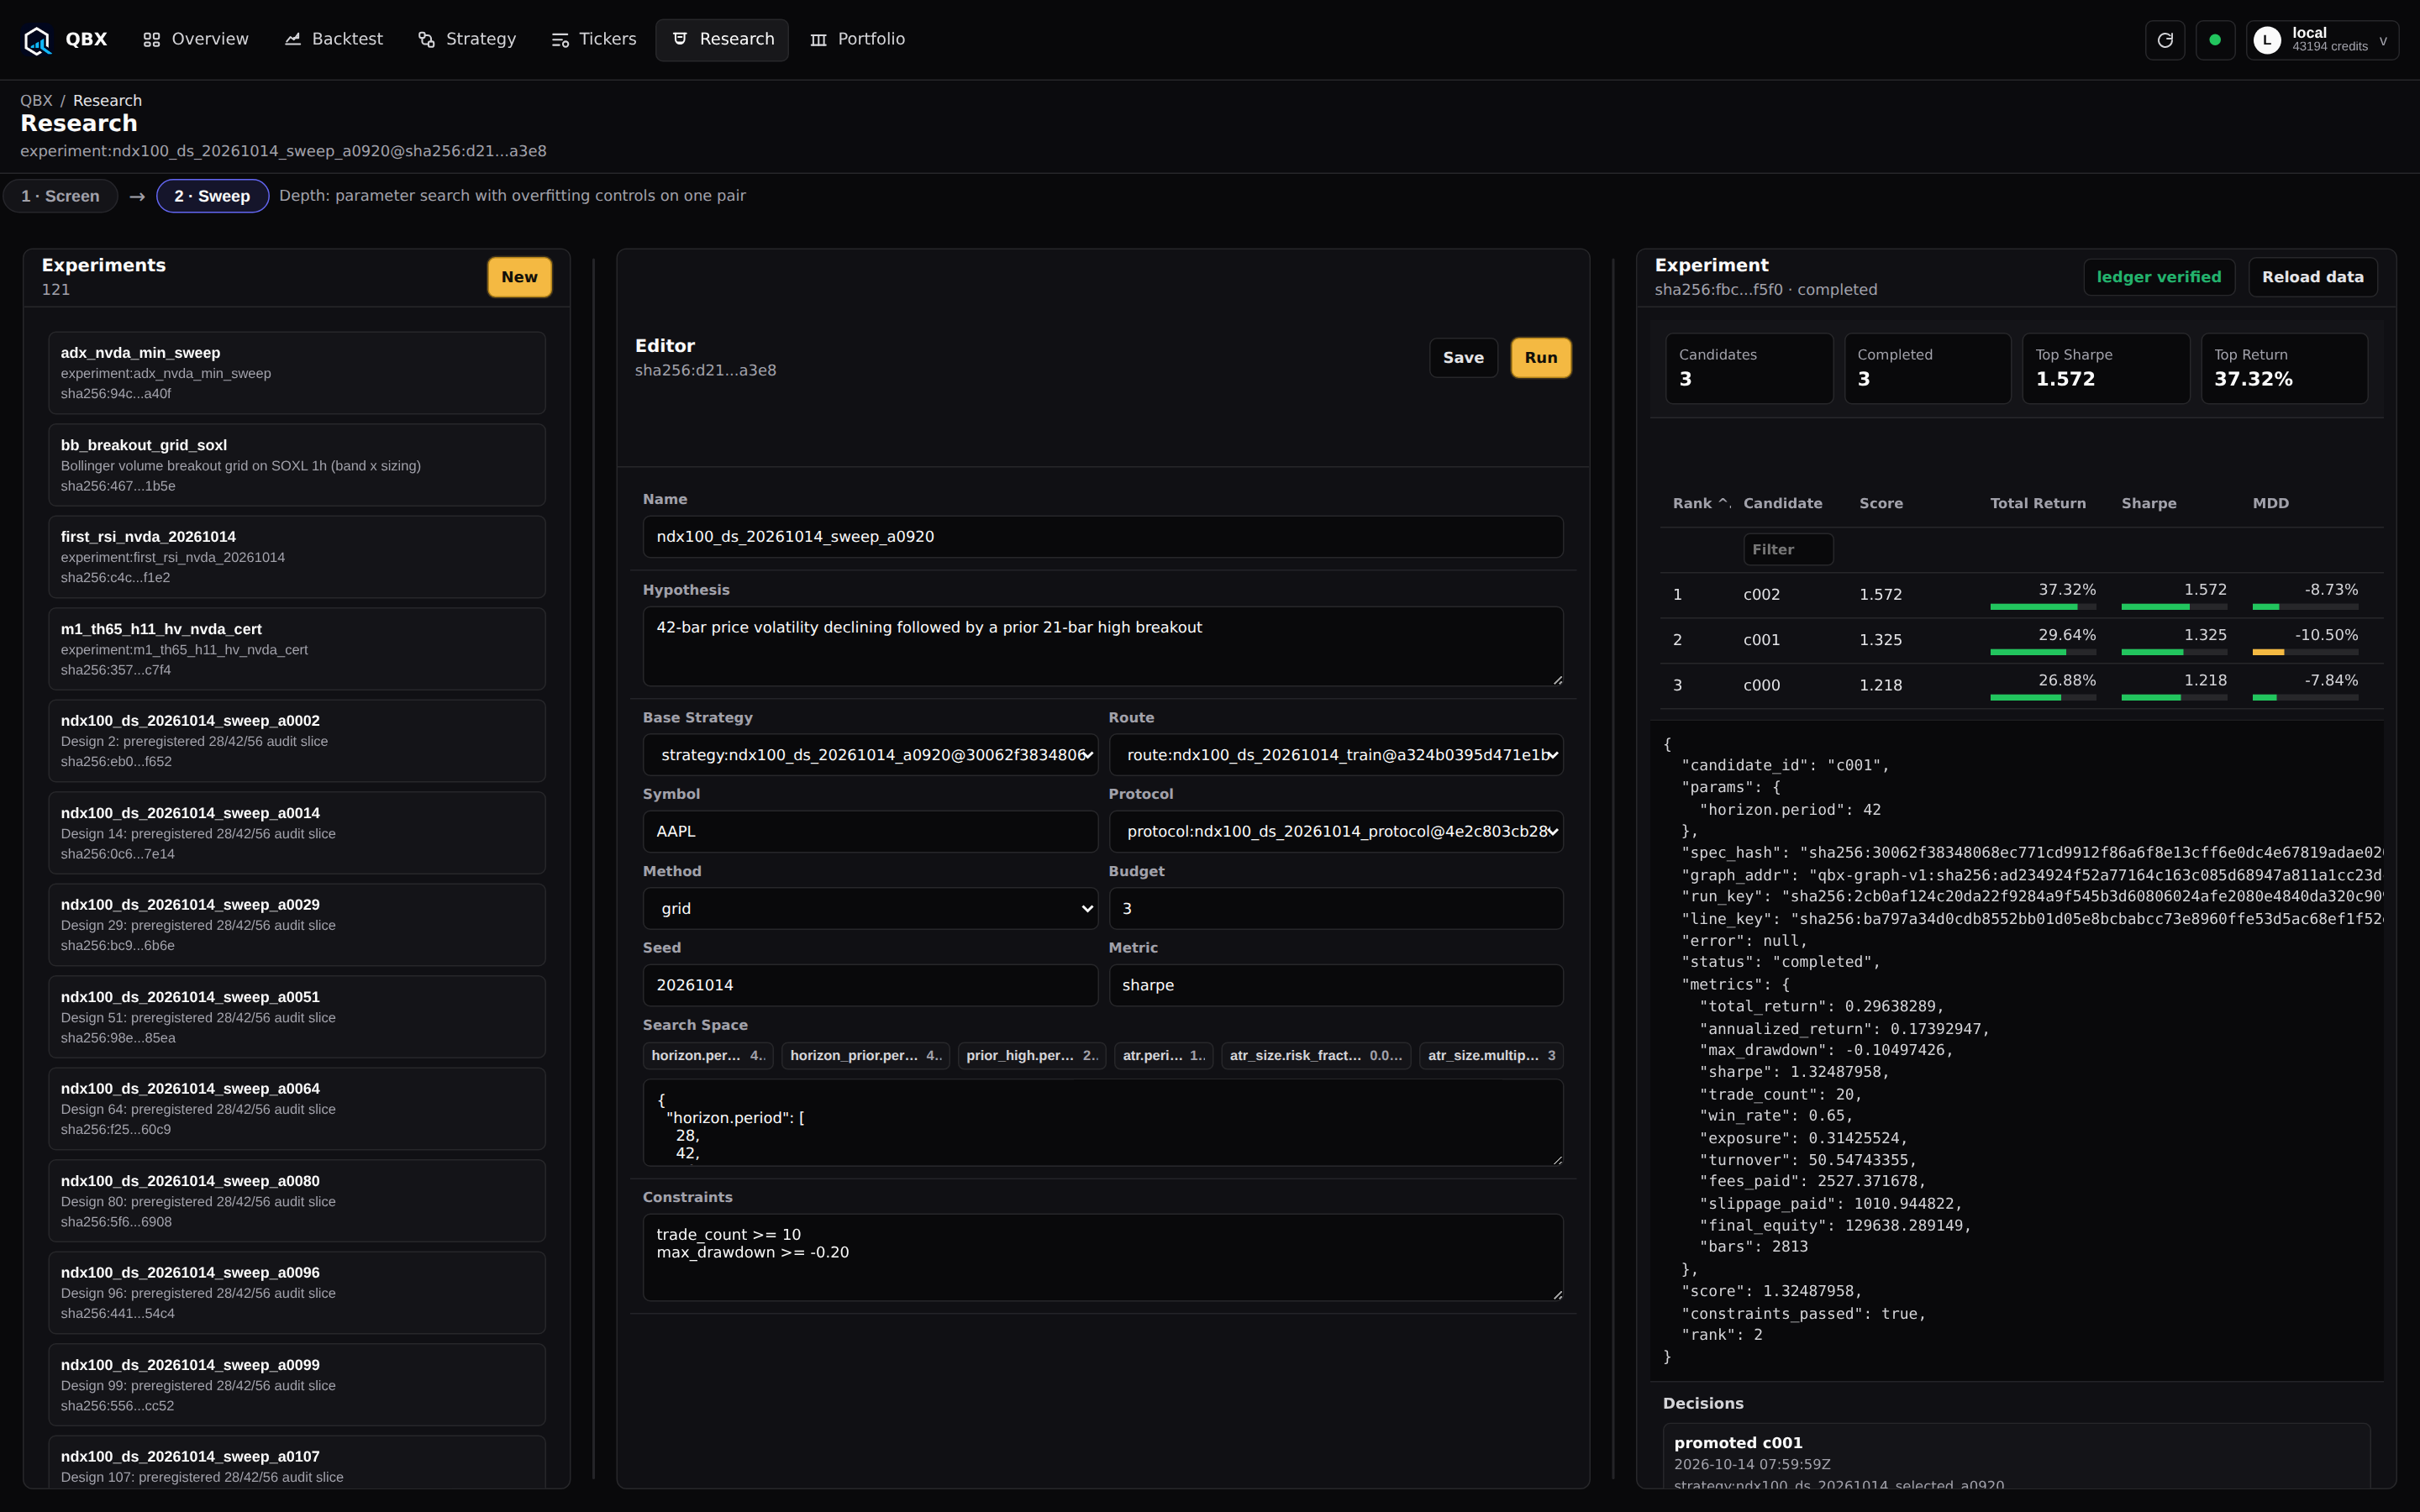
Define a signal, compare it across stocks and test the parameters that matter.
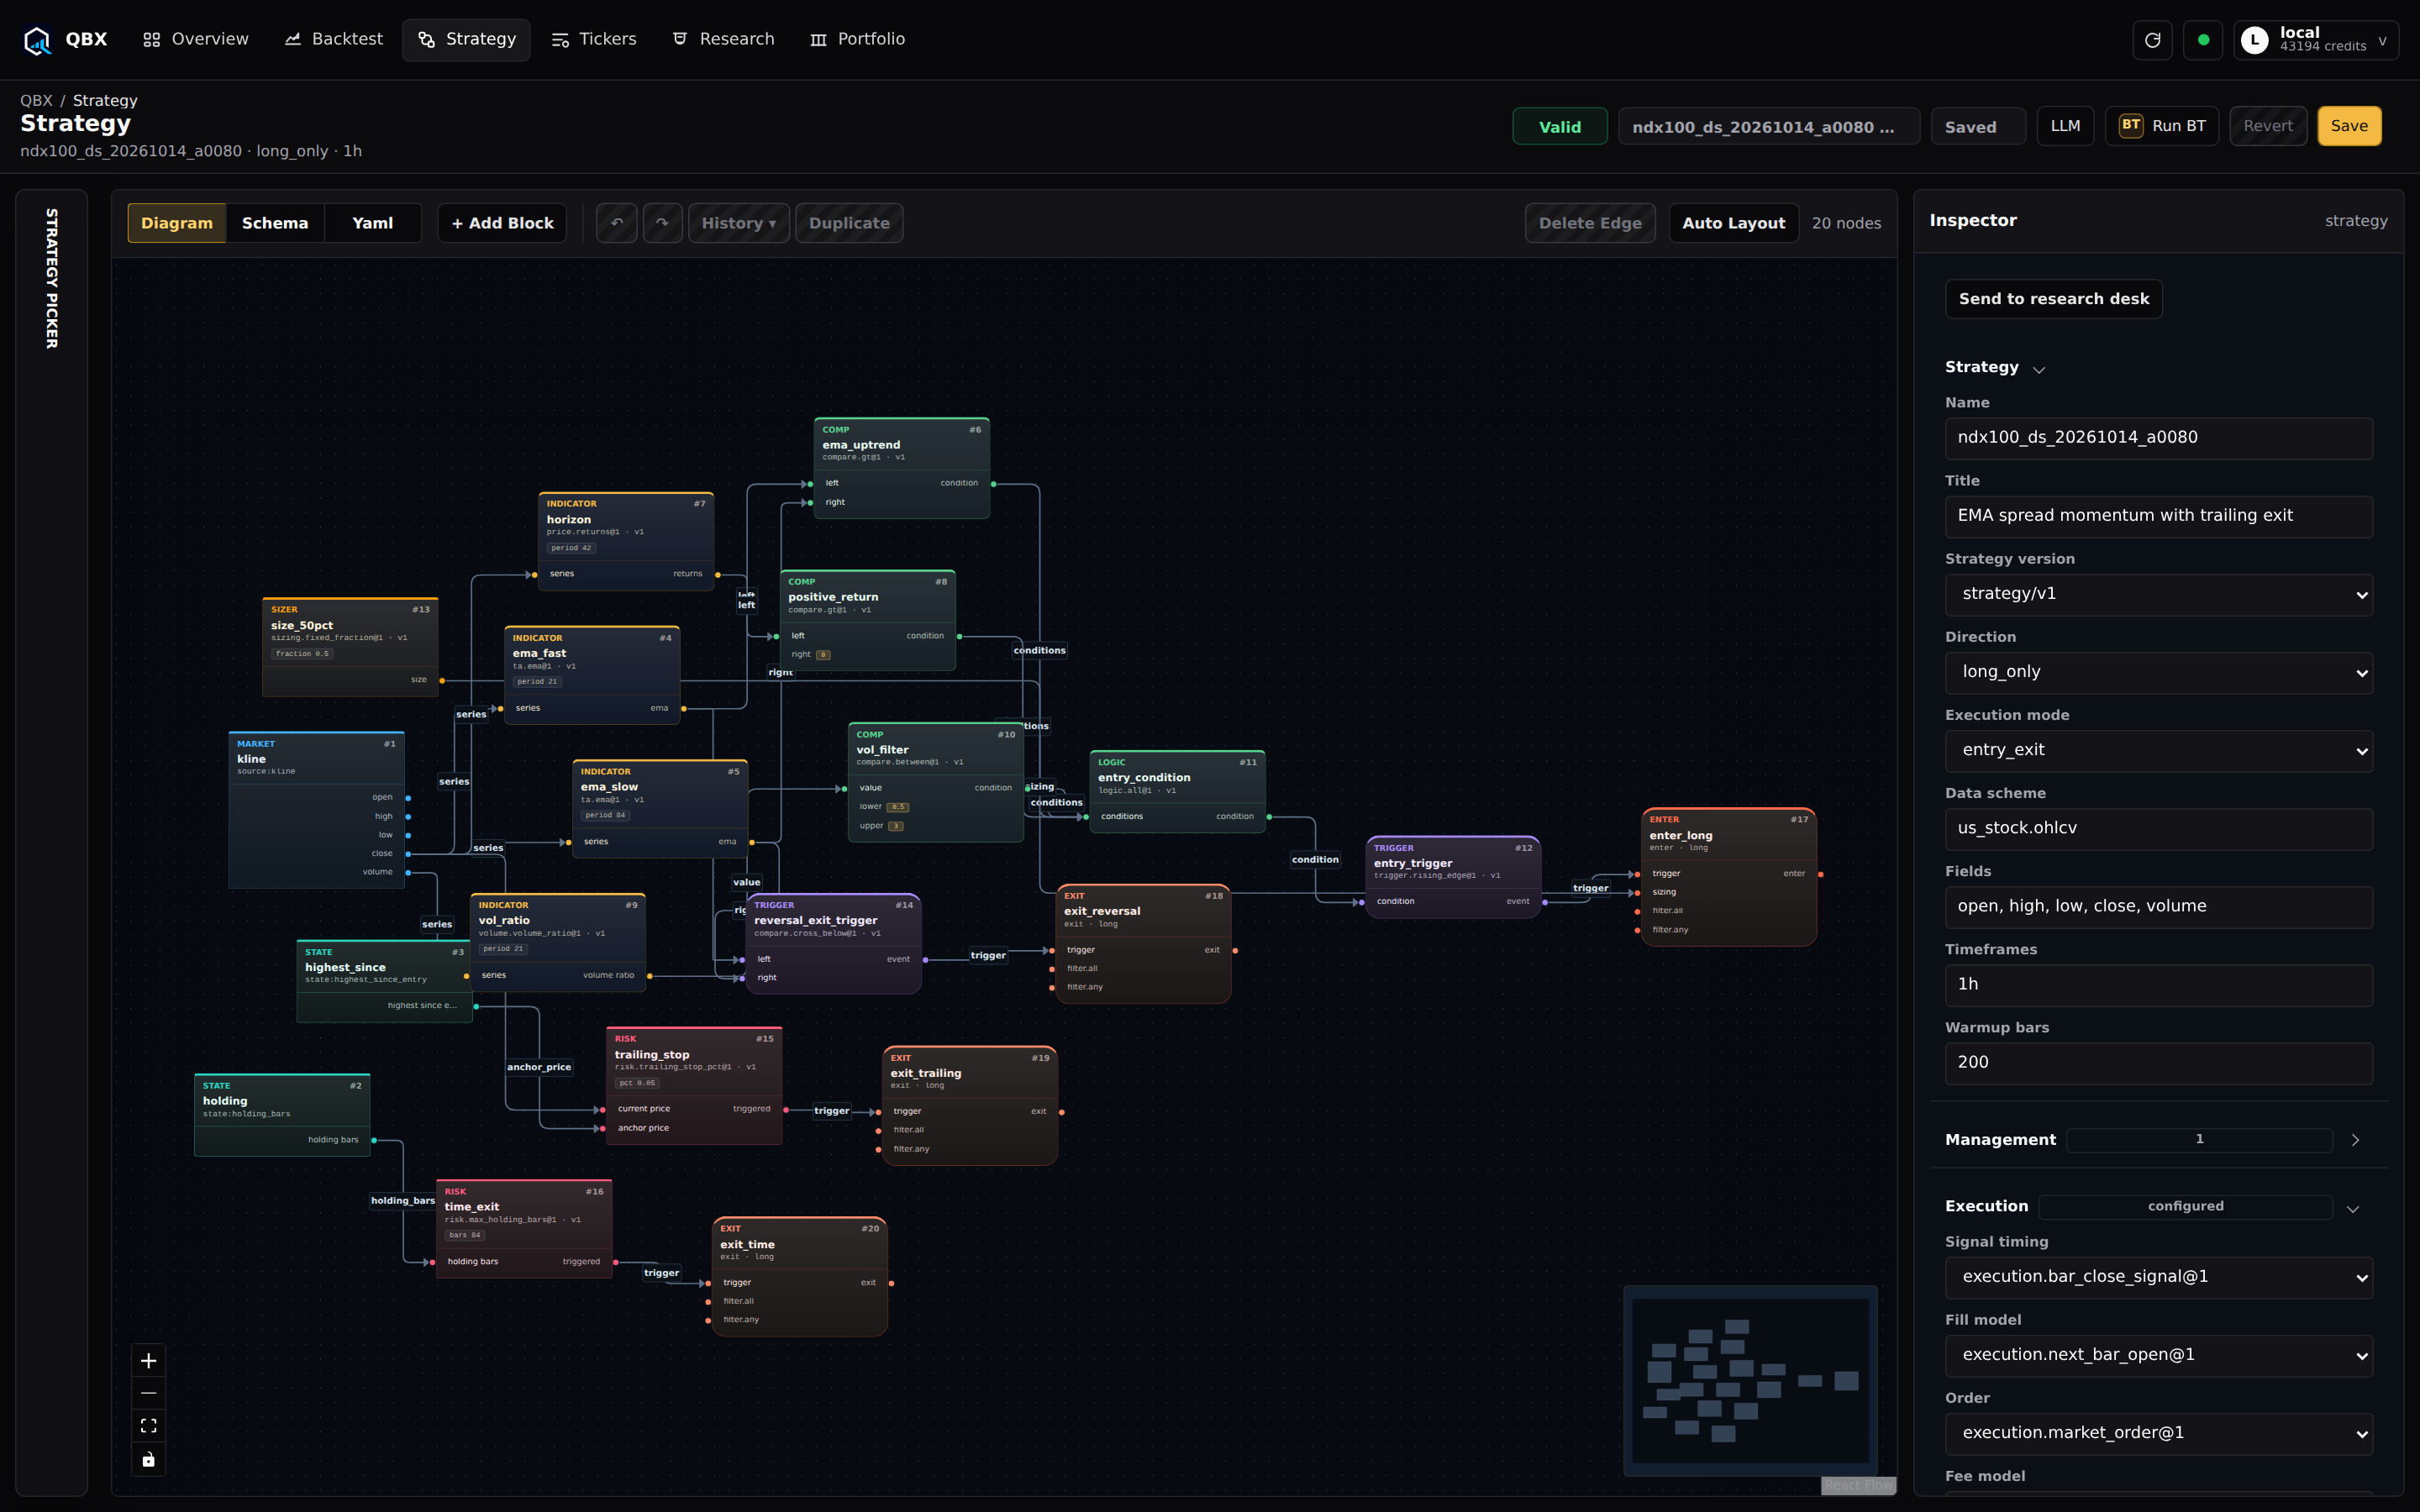
Build a signal from price and volume data, with its logic visible in the strategy graph.
View in QBX ↗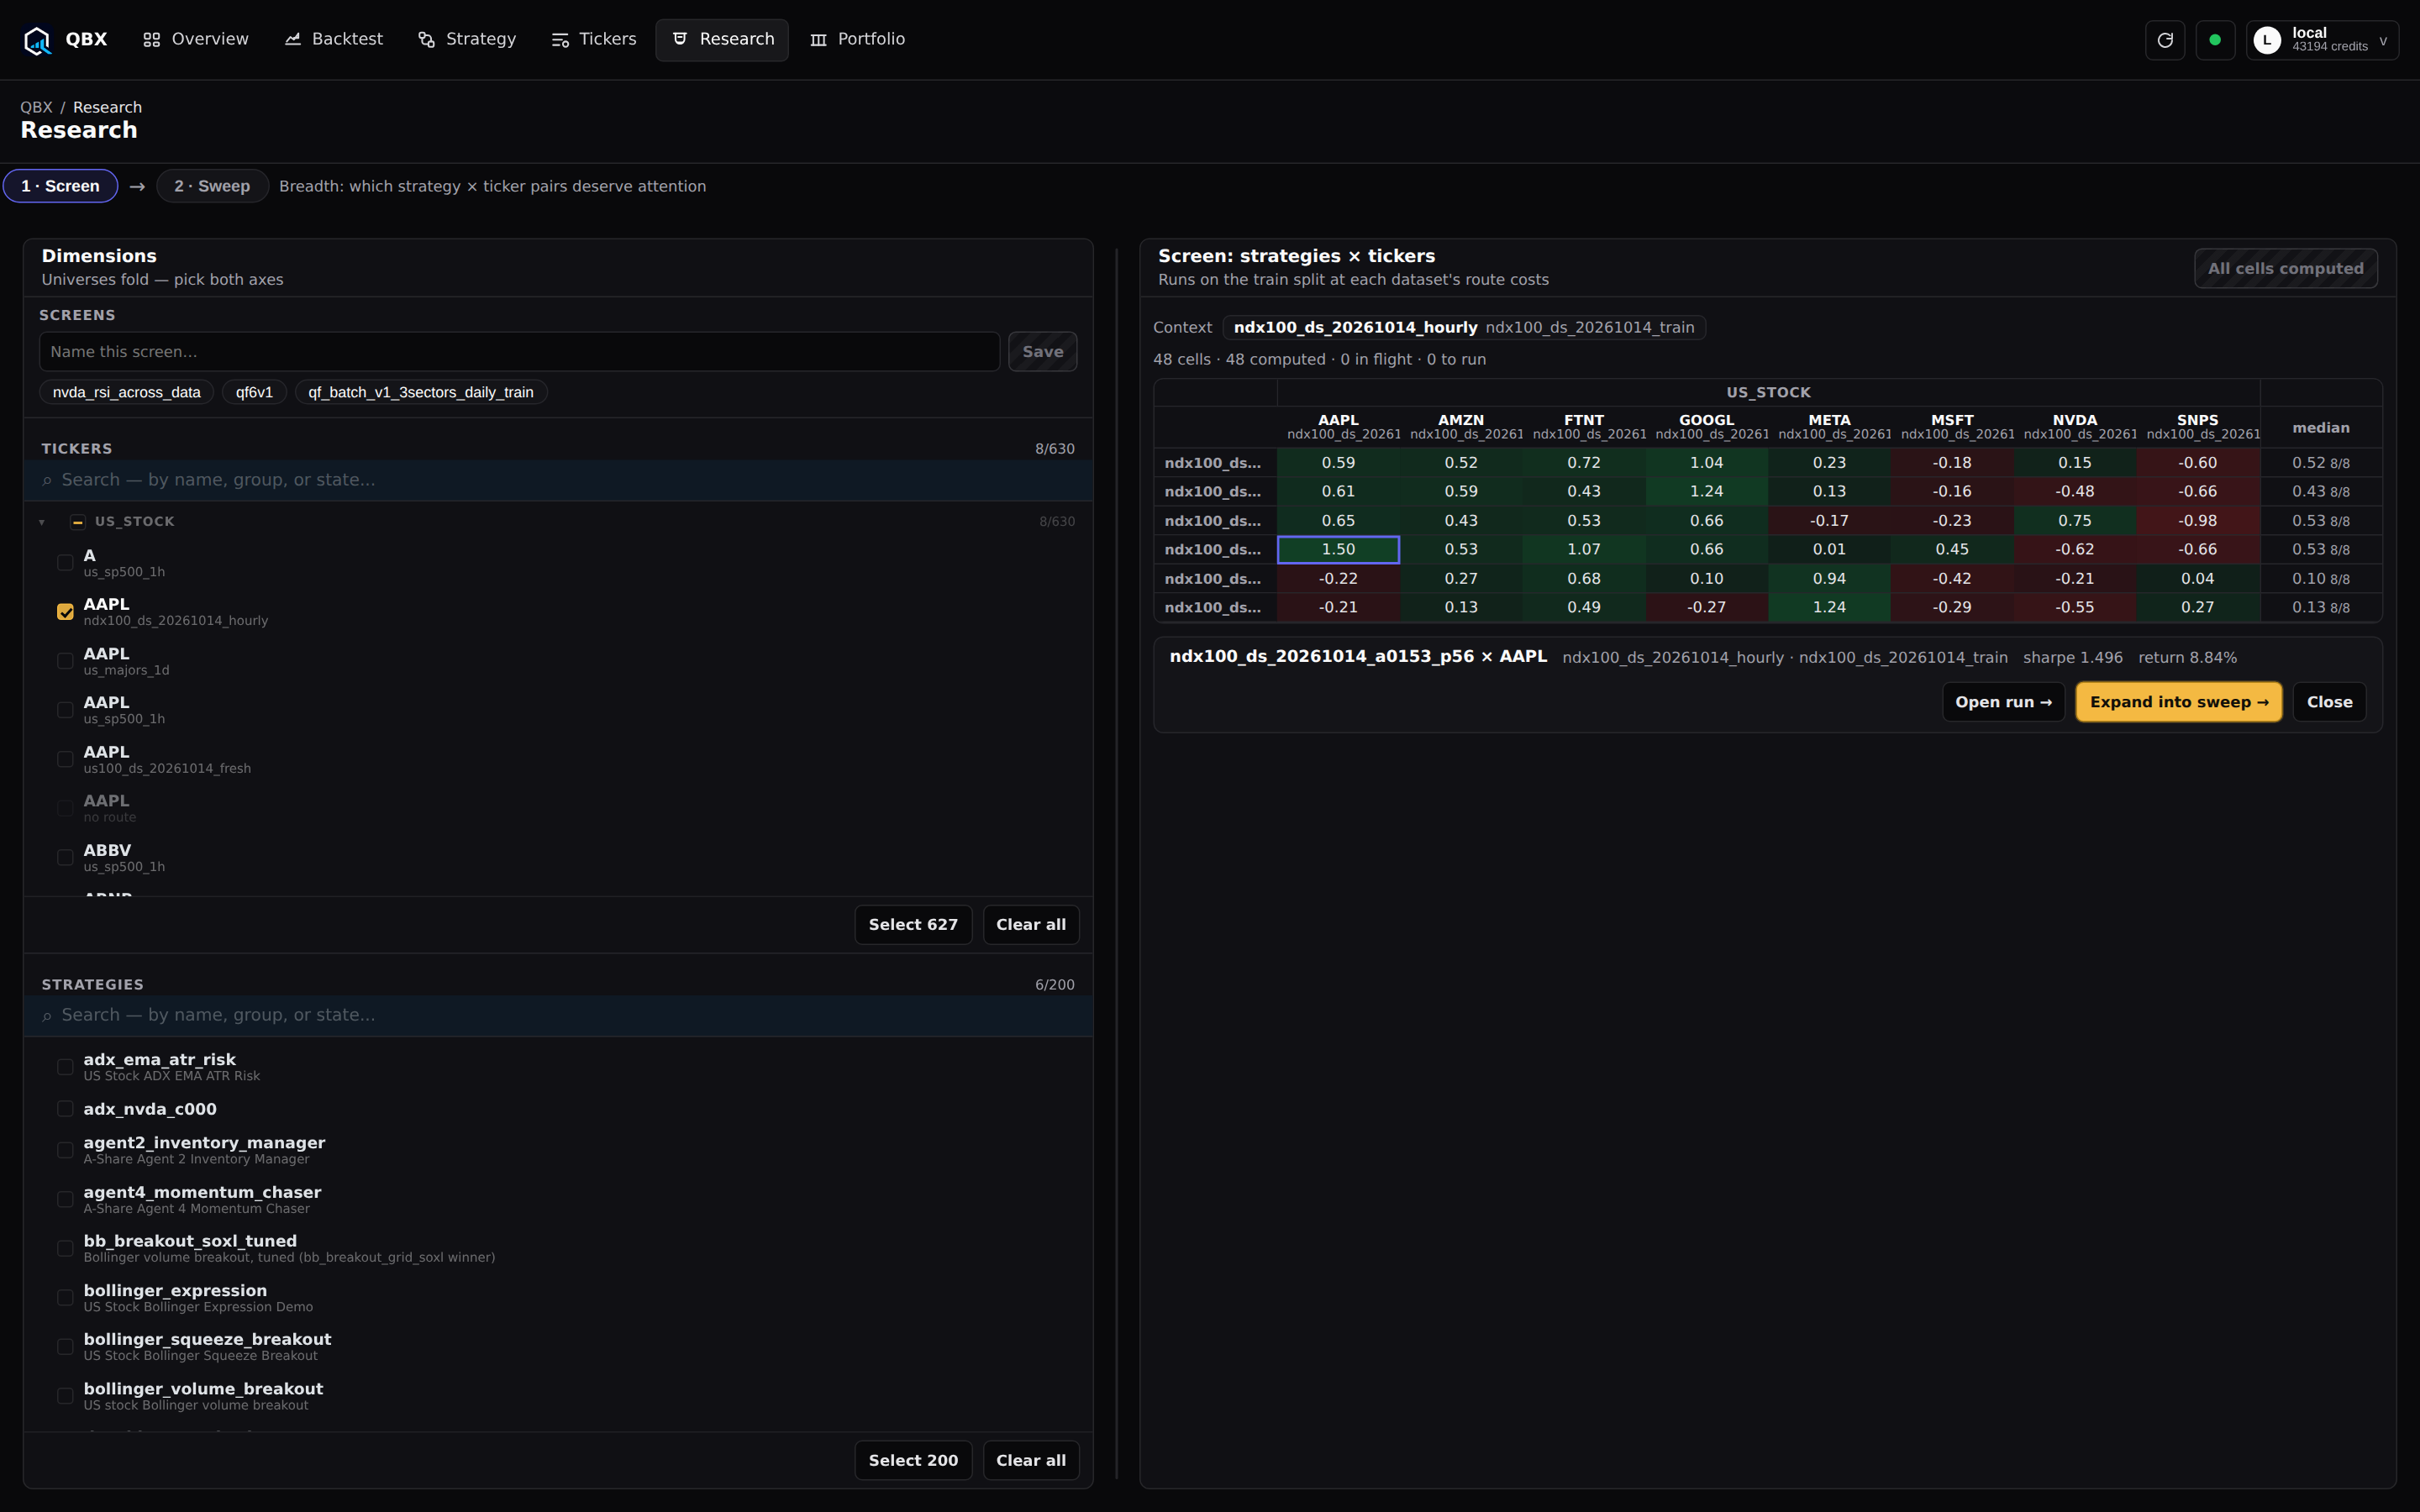
Make the model inspectable.
Connect a model’s predictions to trading rules, then review the trades it produces.
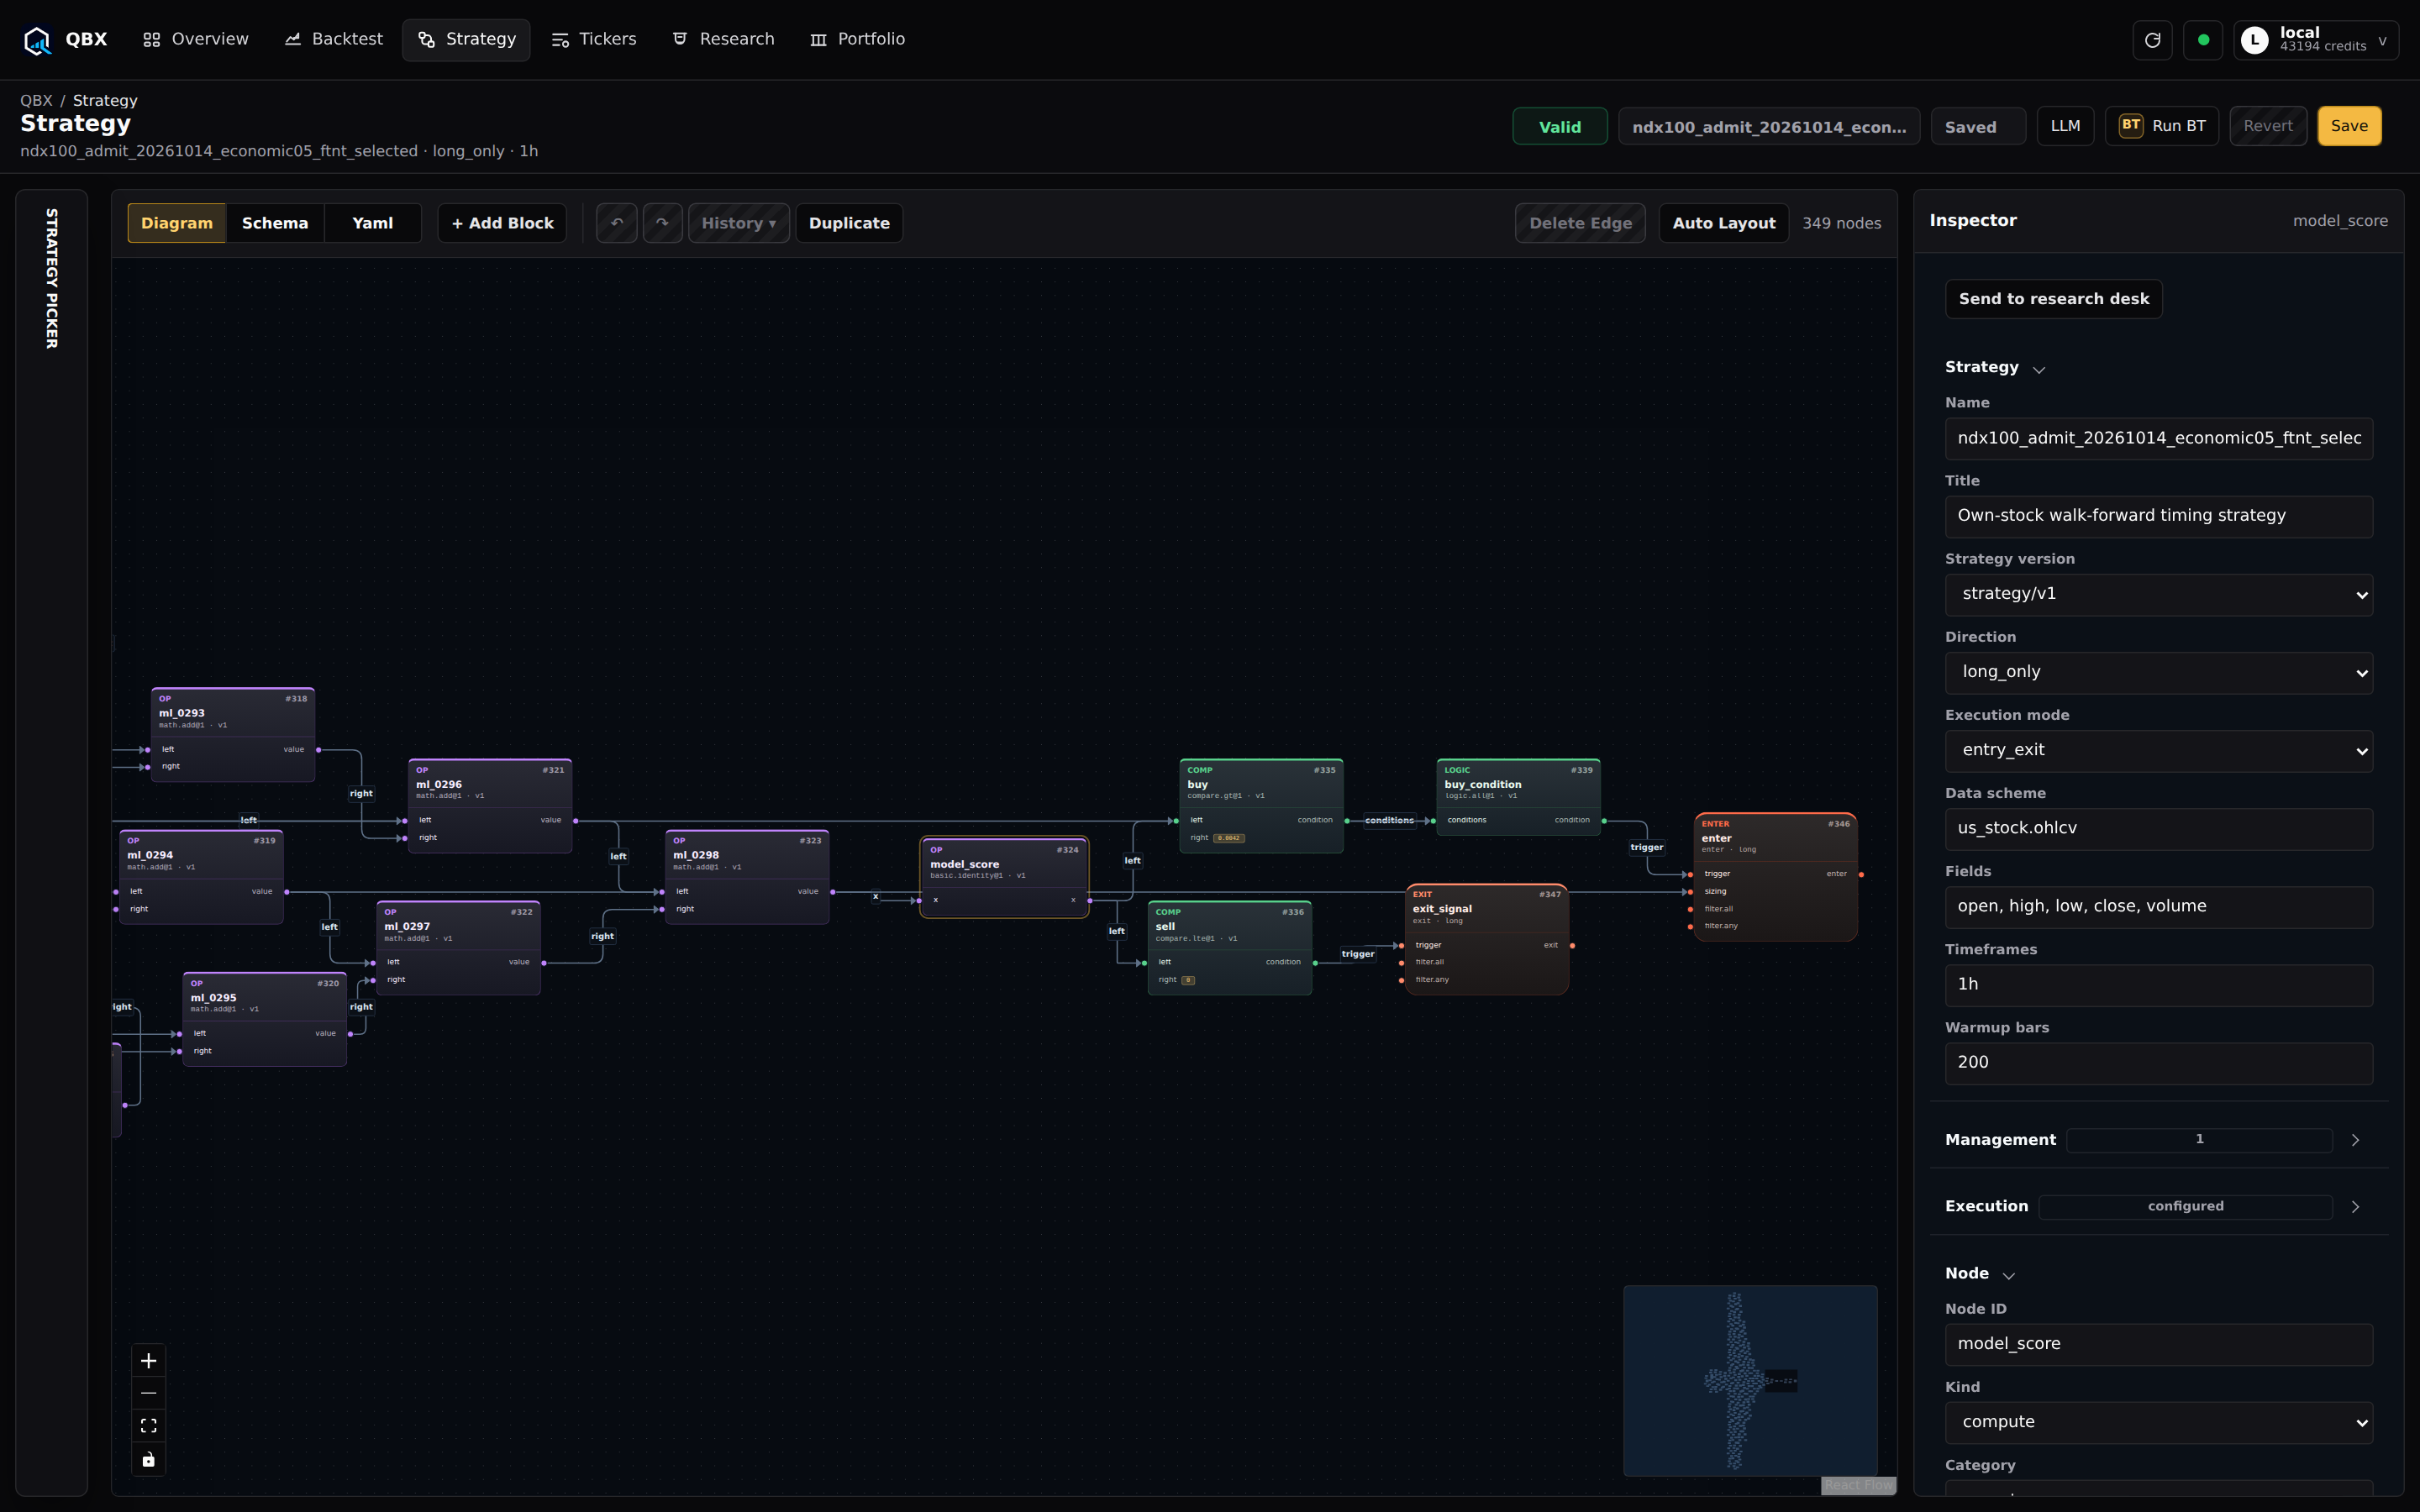
Connect the FTNT model’s signal to entry, exit and position-sizing rules.
View in QBX ↗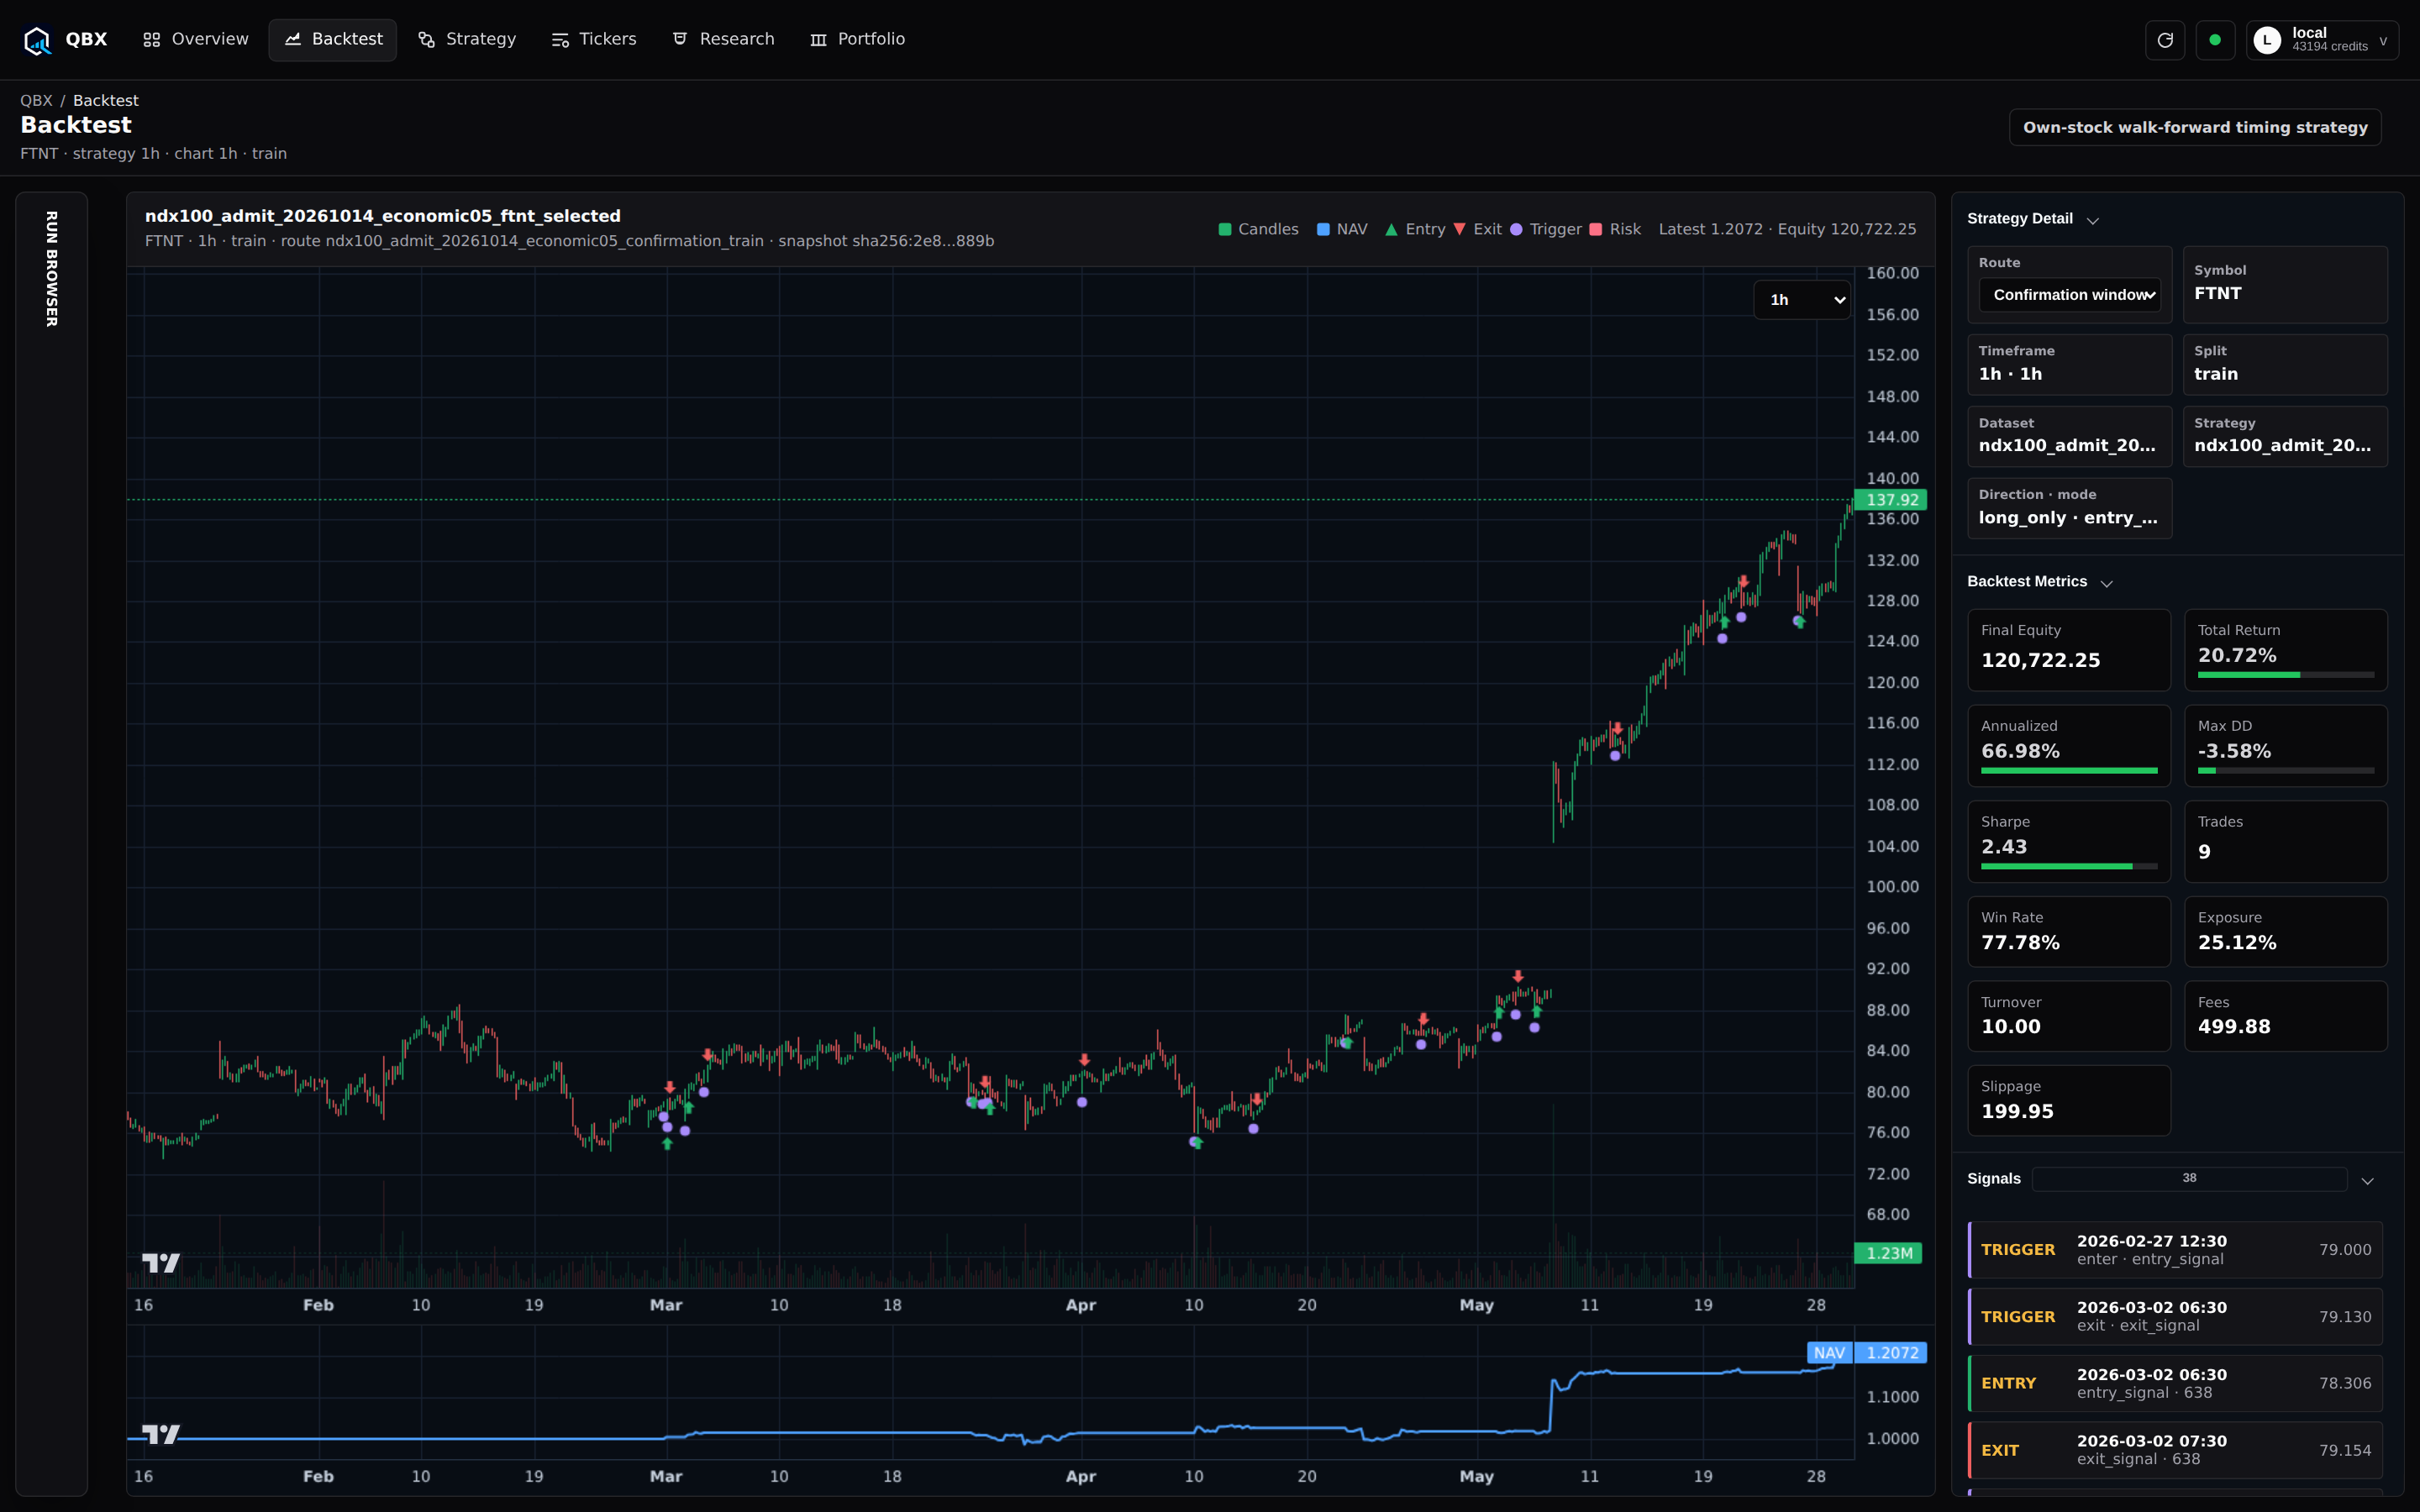
Look beyond a single winner.
Compare individual strategies on validation data, including their returns, drawdowns and trading activity.
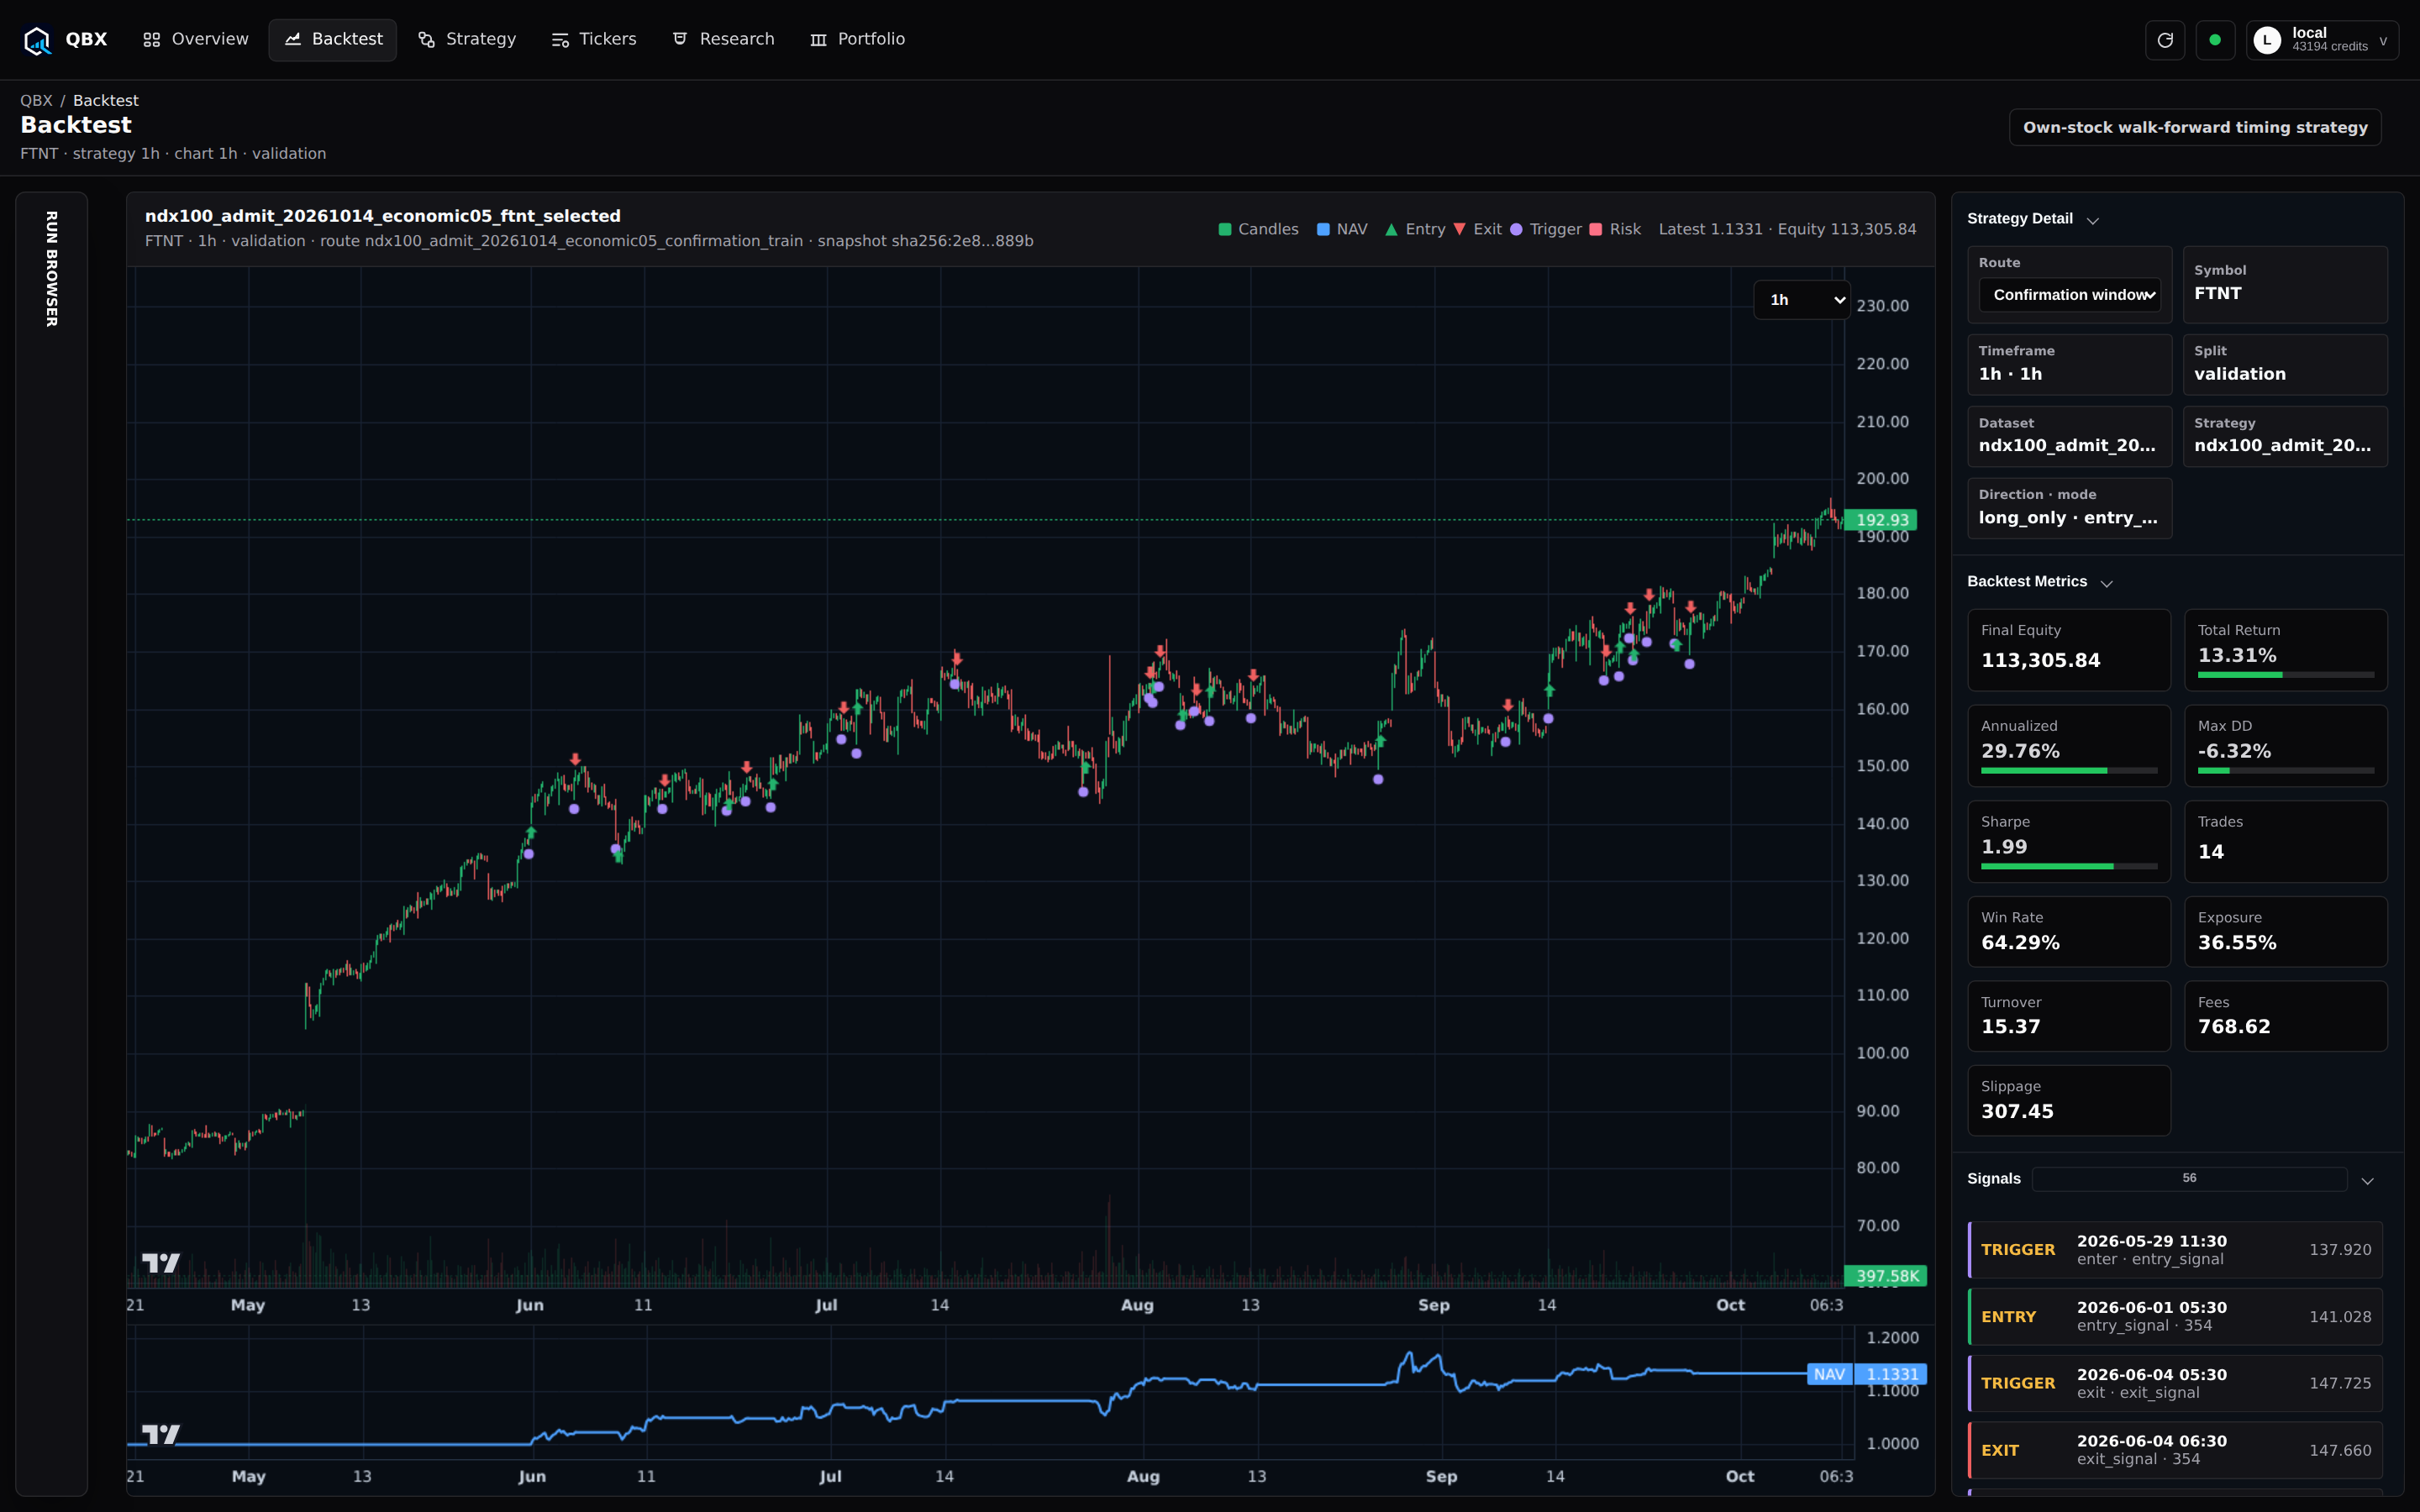
Compare FTNT’s validation results with its earlier confirmation run.
View in QBX ↗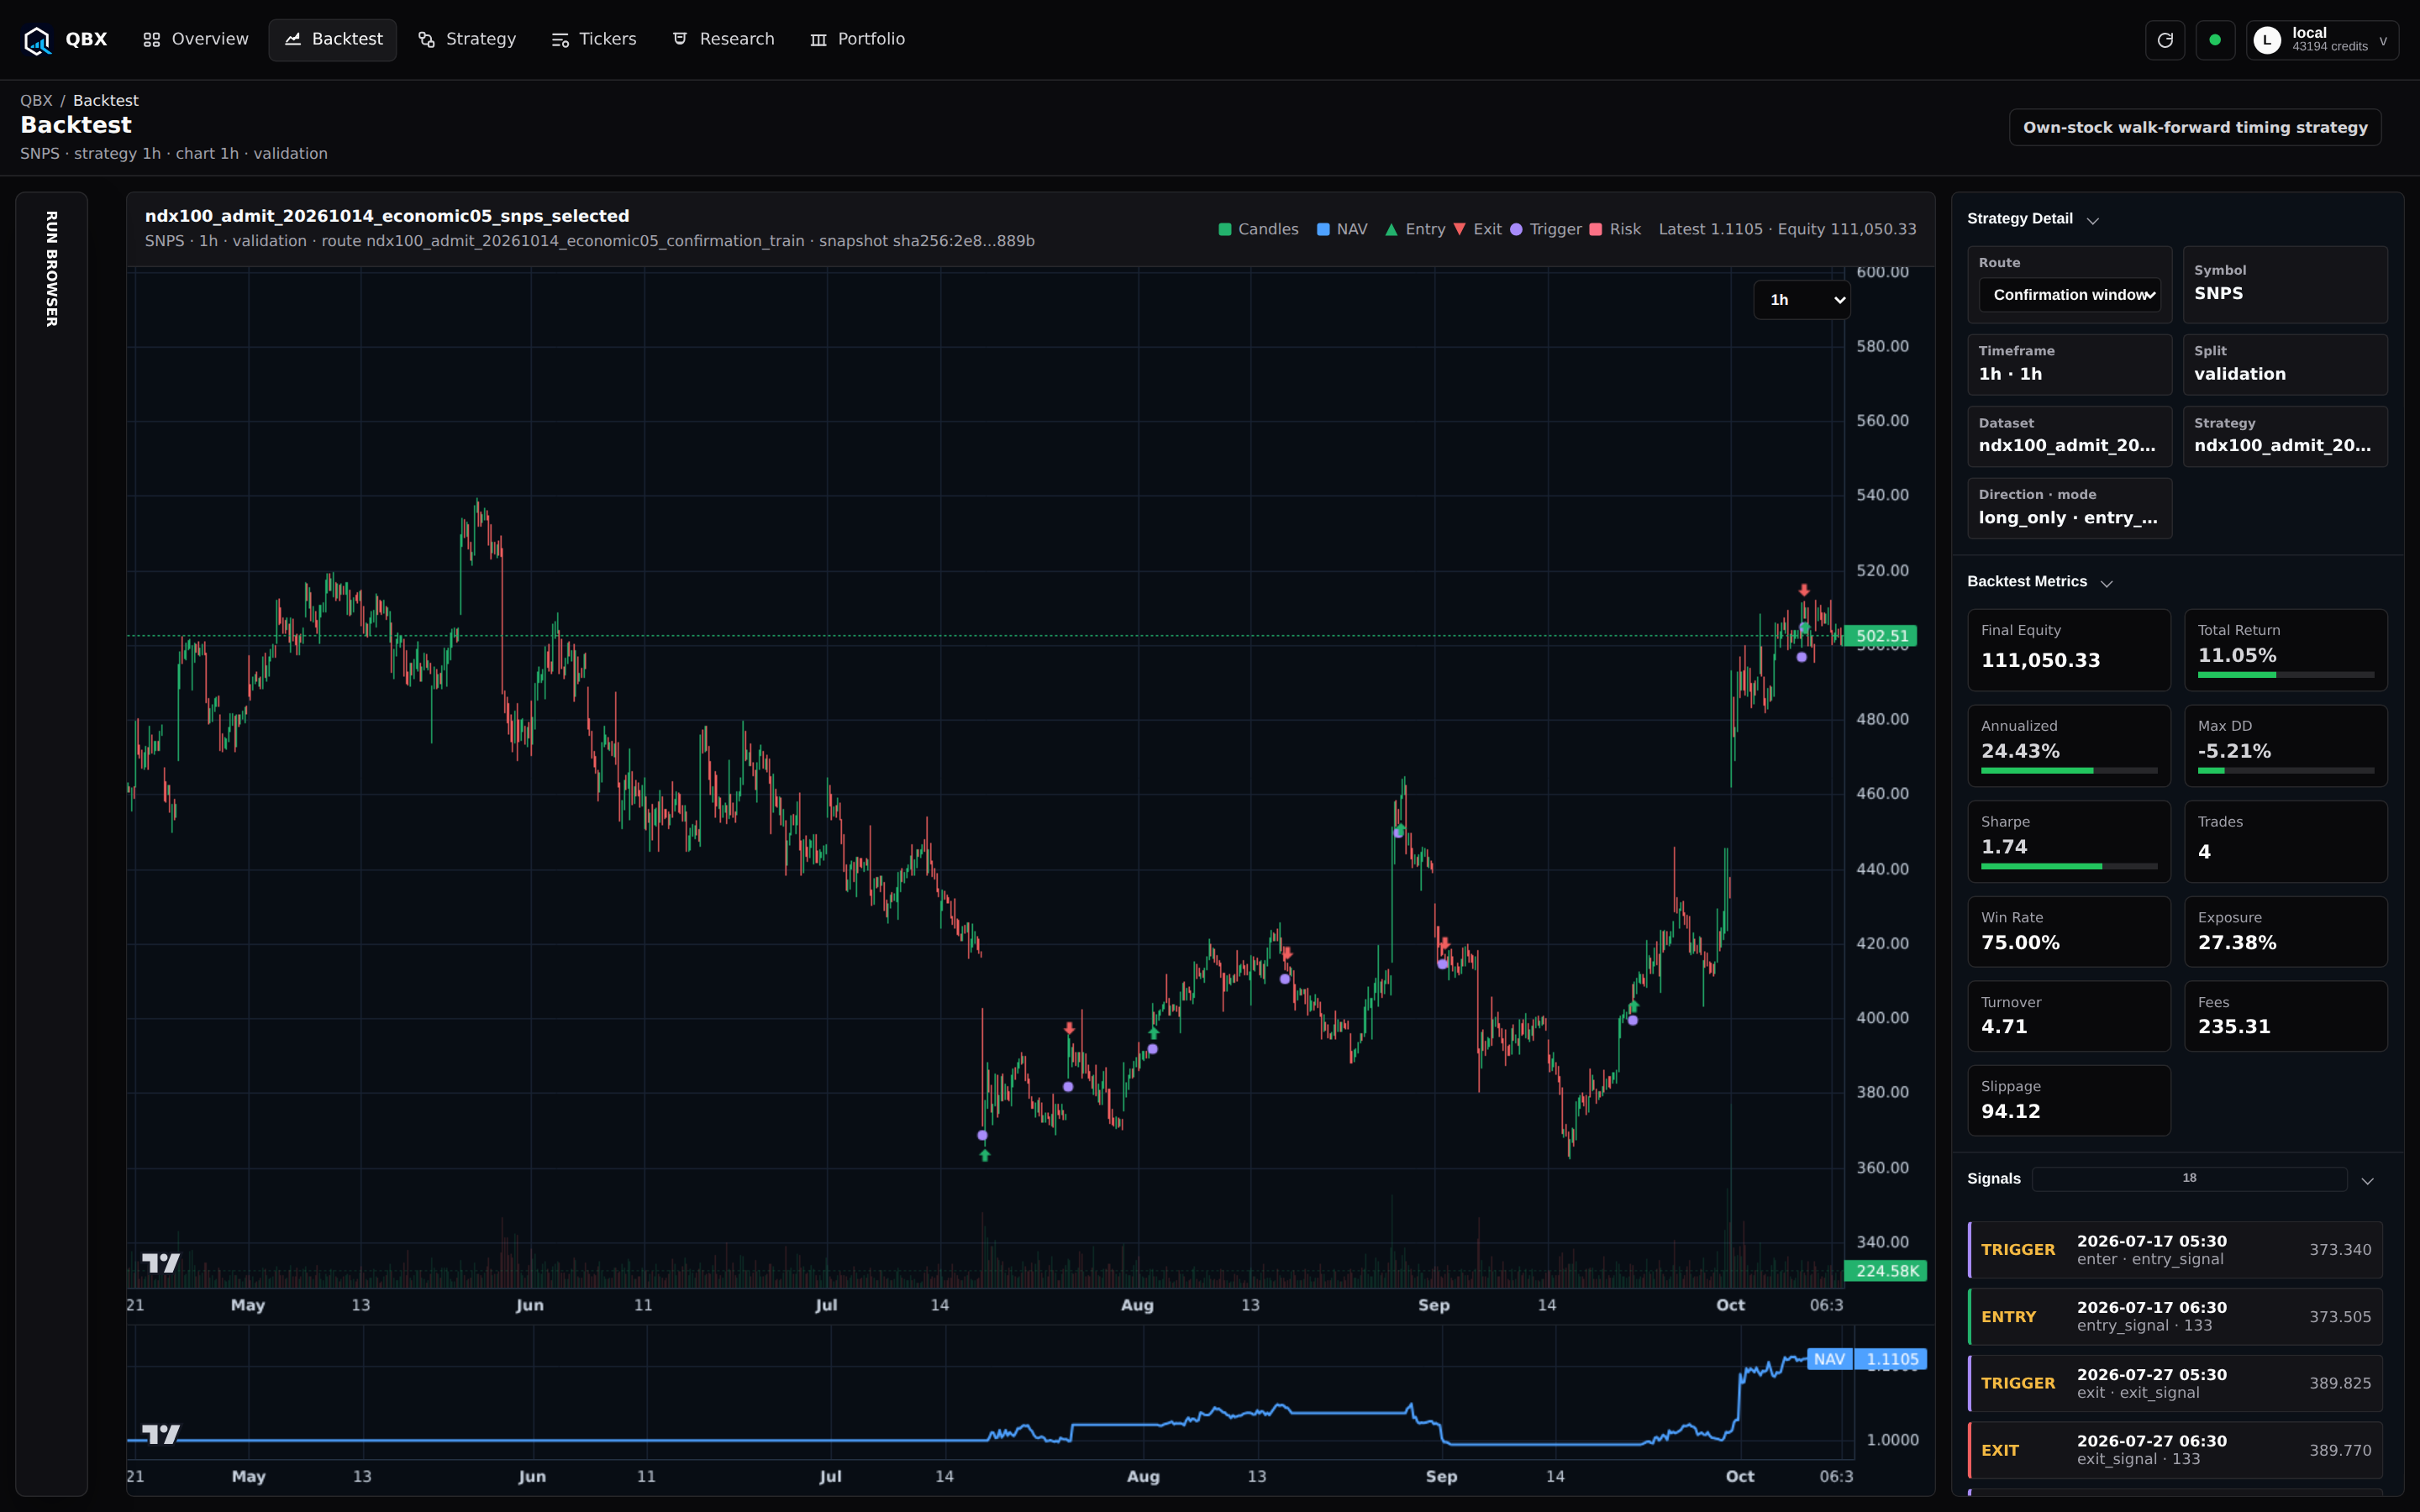
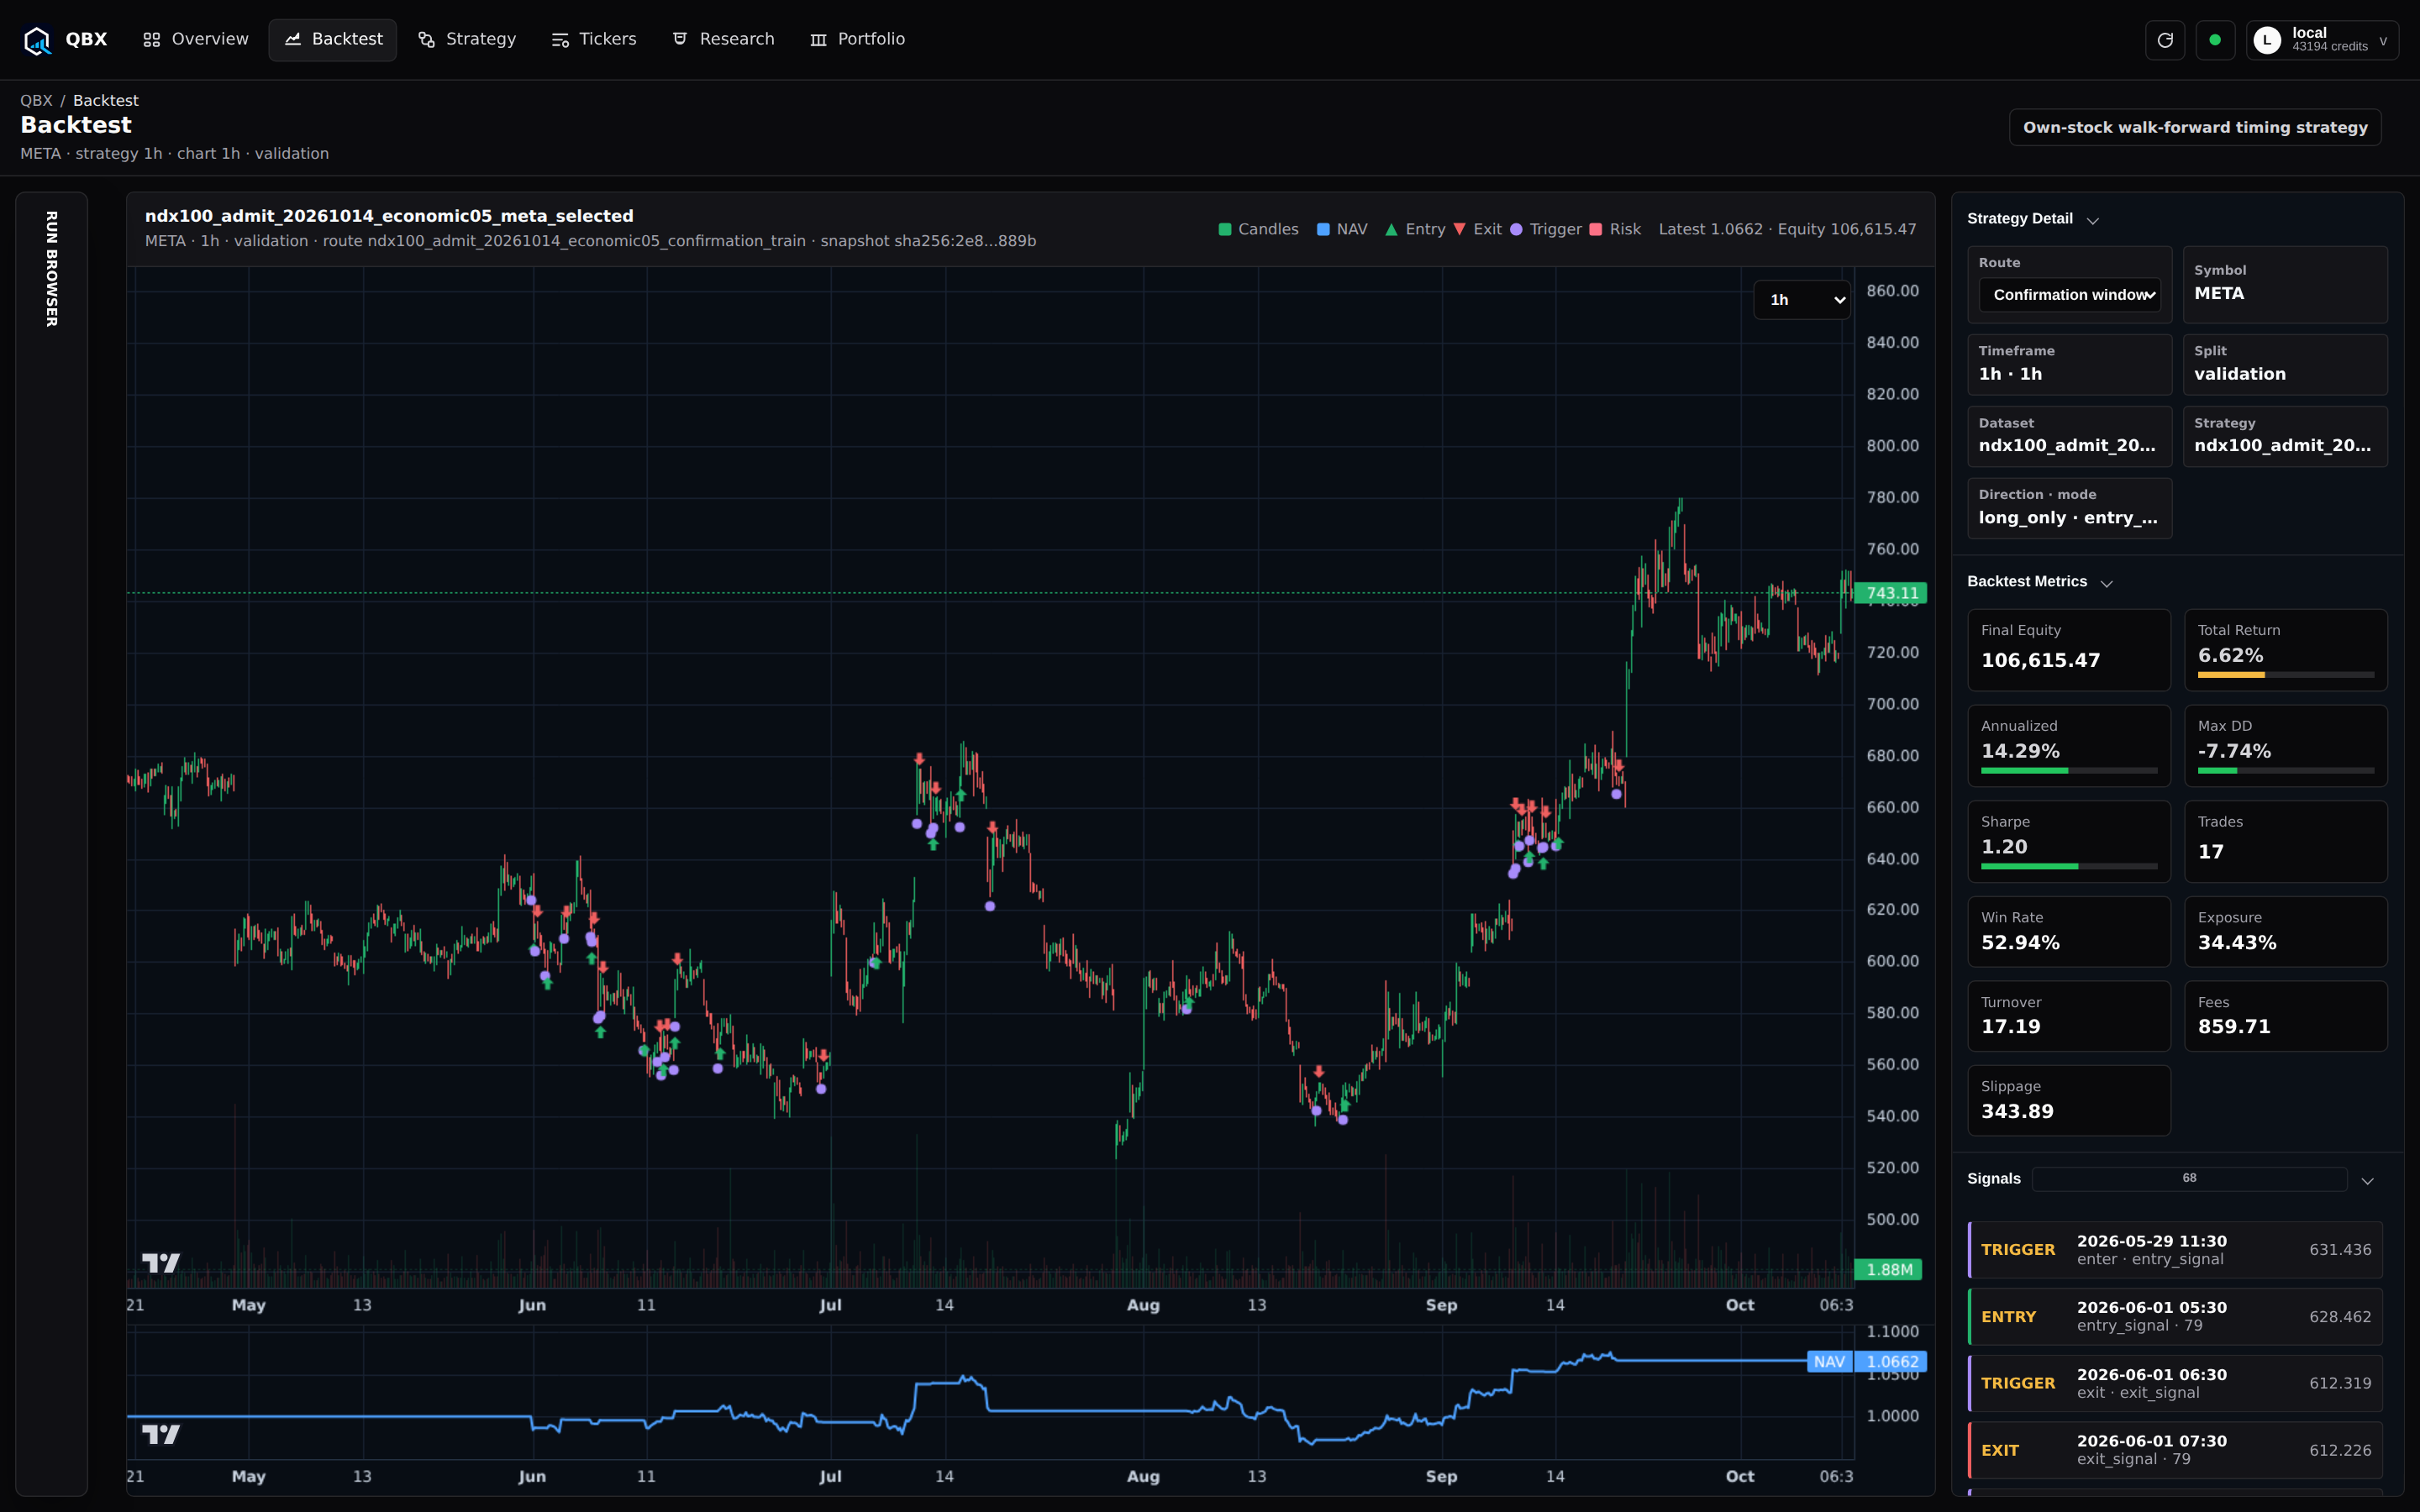
See the portfolio as a whole.
Examine how strategy weights and correlations shape the portfolio’s returns.
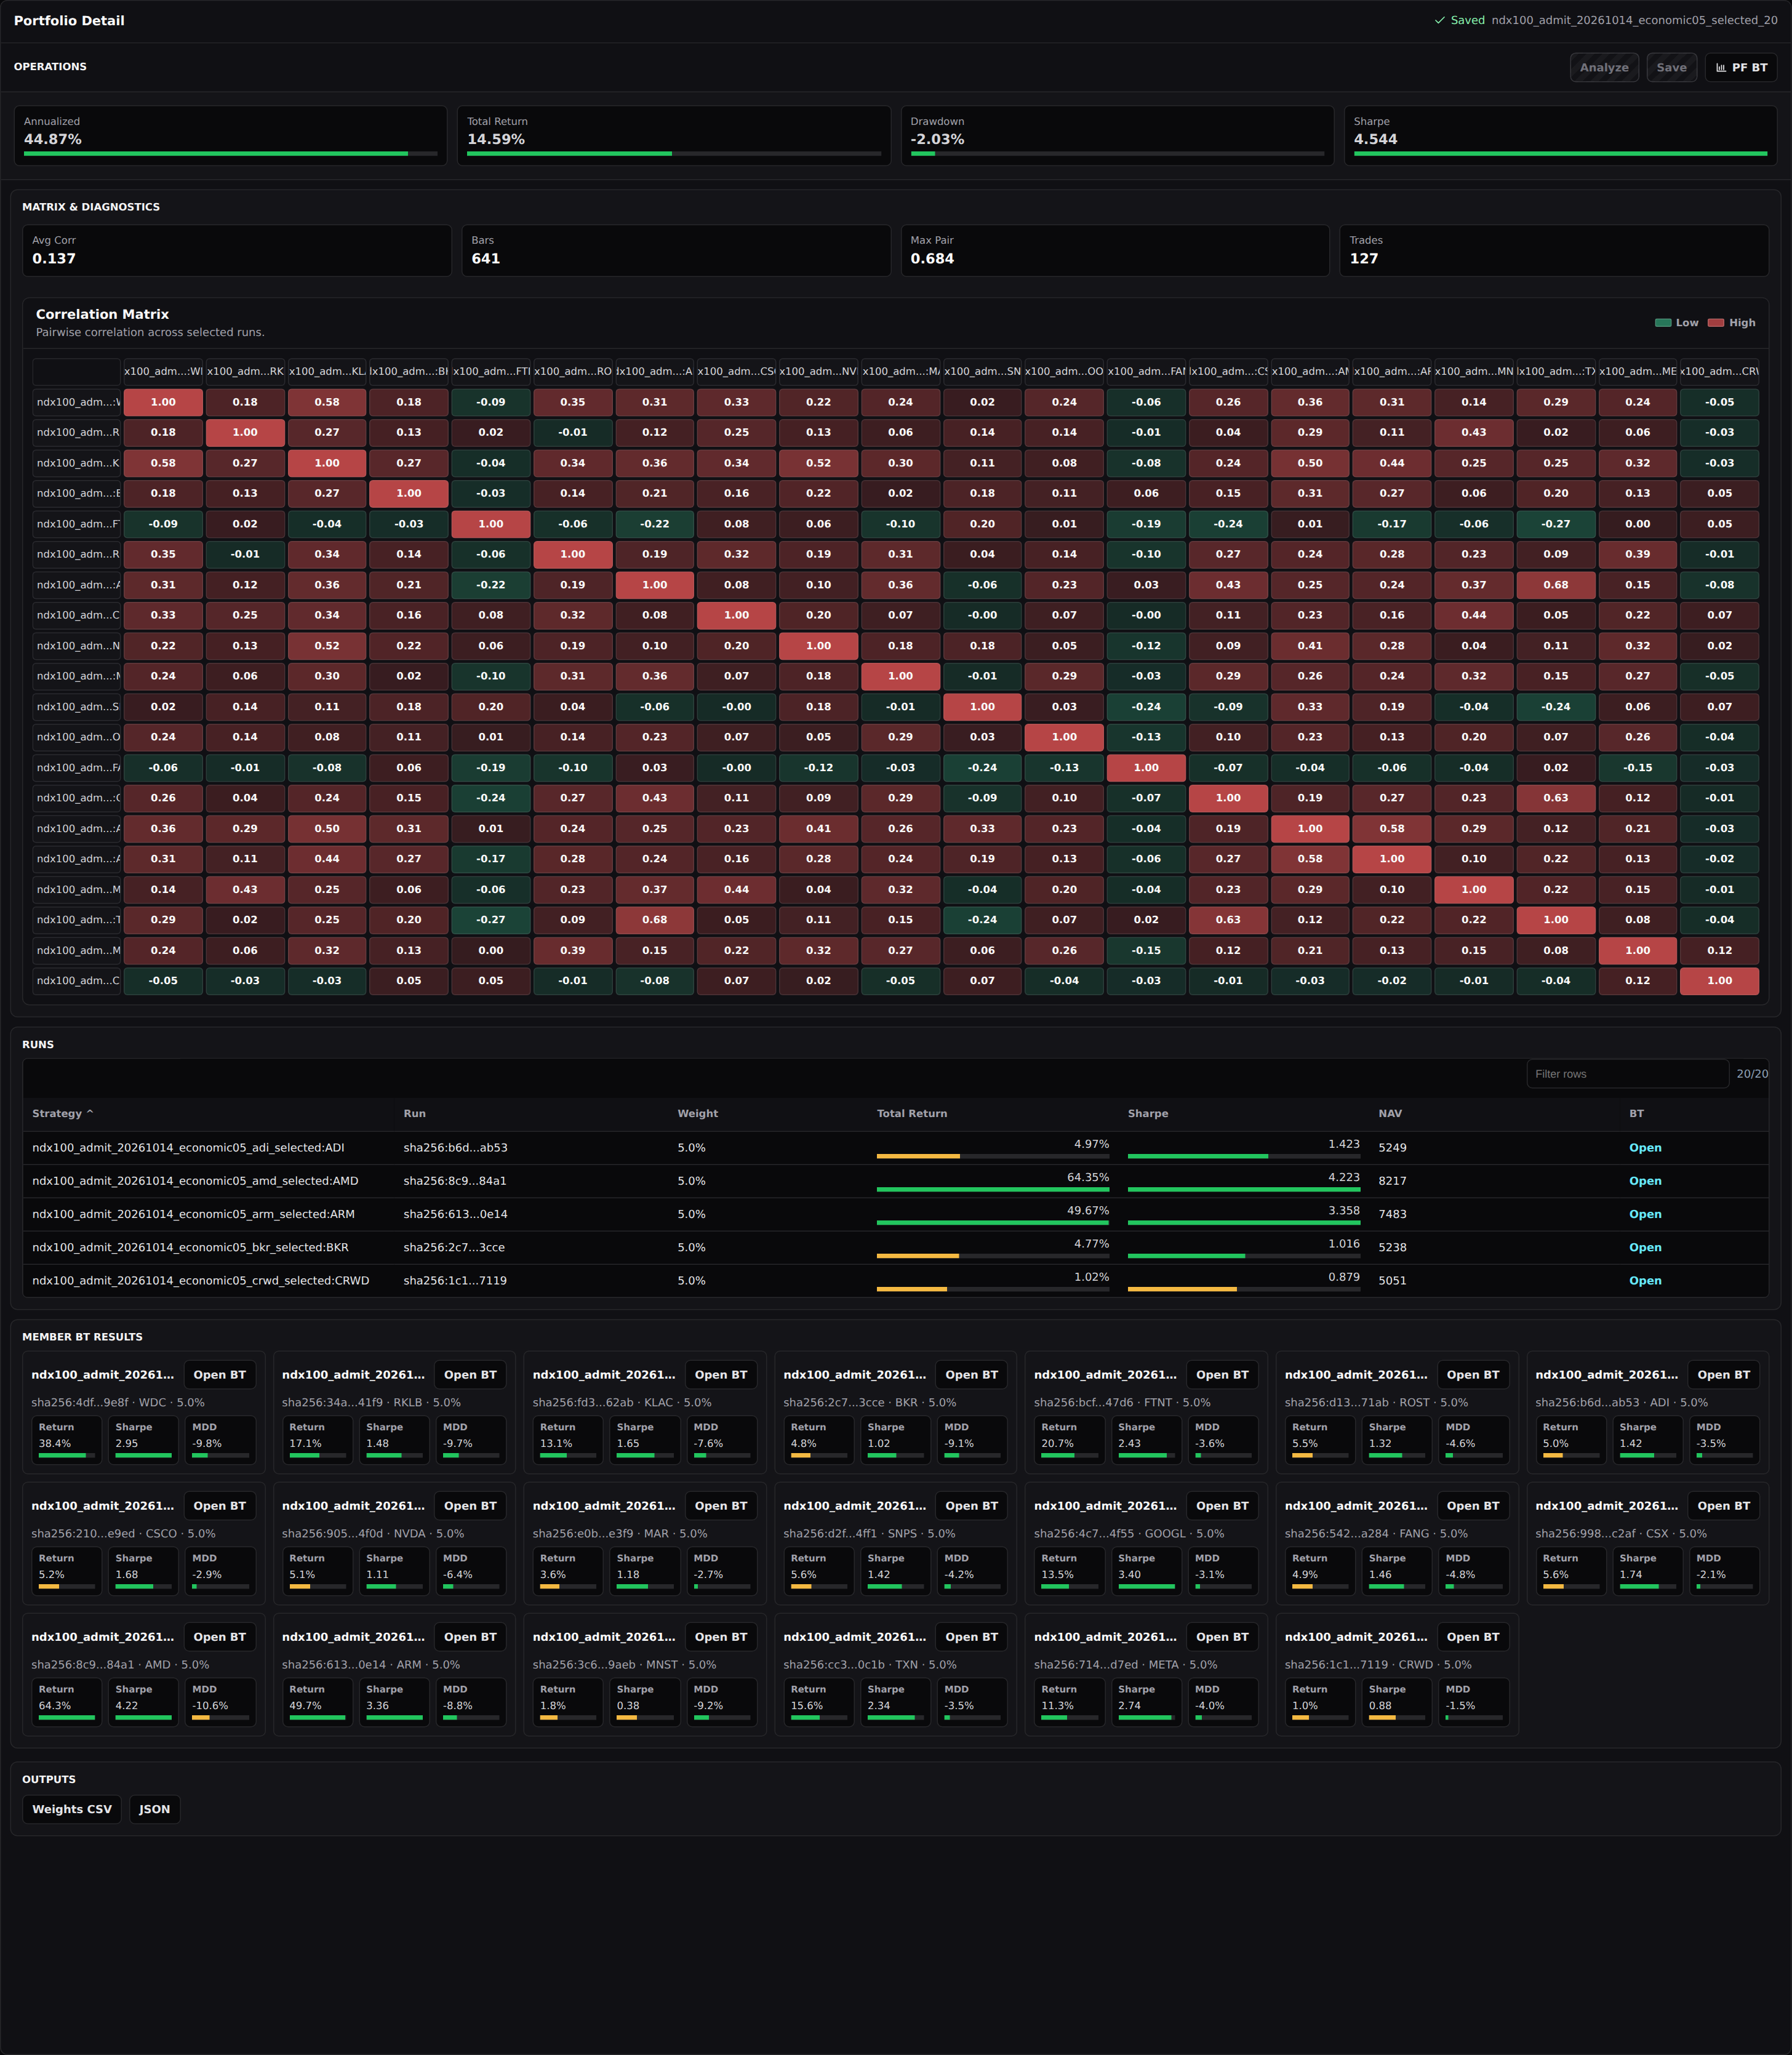
Compare strategy weights and correlations before combining them into a portfolio.
View in QBX ↗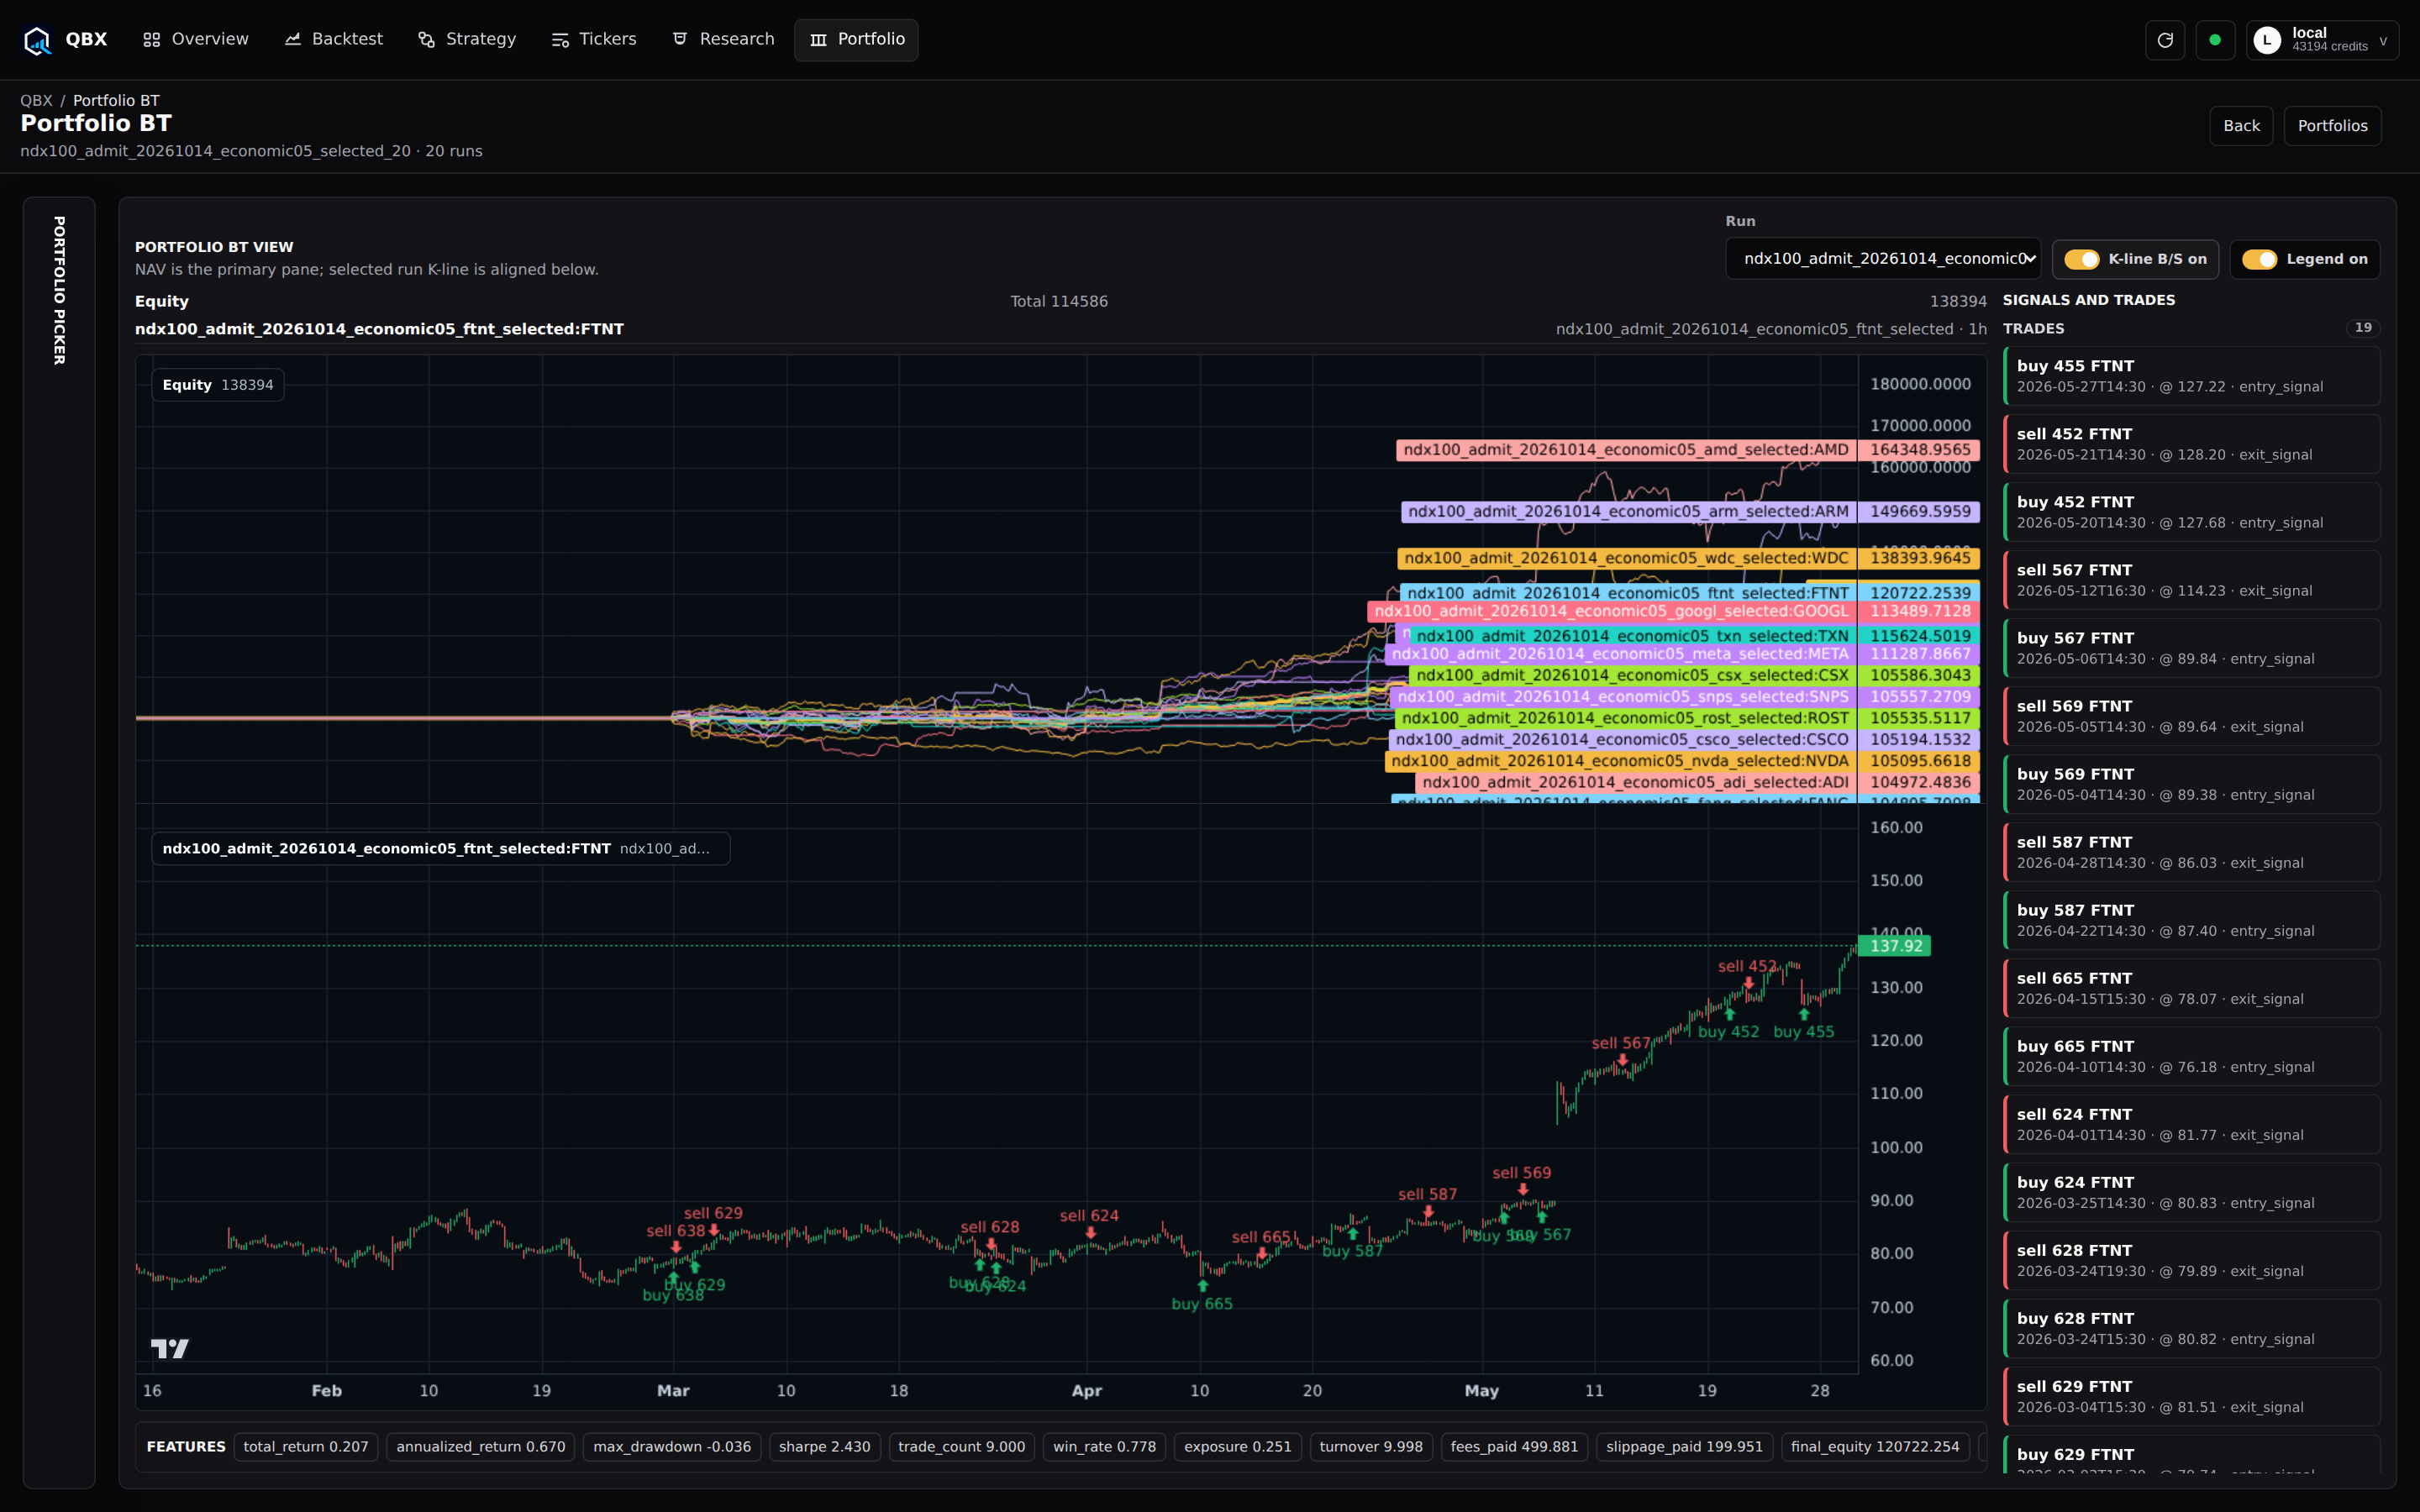
The final test.
The portfolio returned −0.75% in final validation. Review the checks behind the decision before taking the research further.
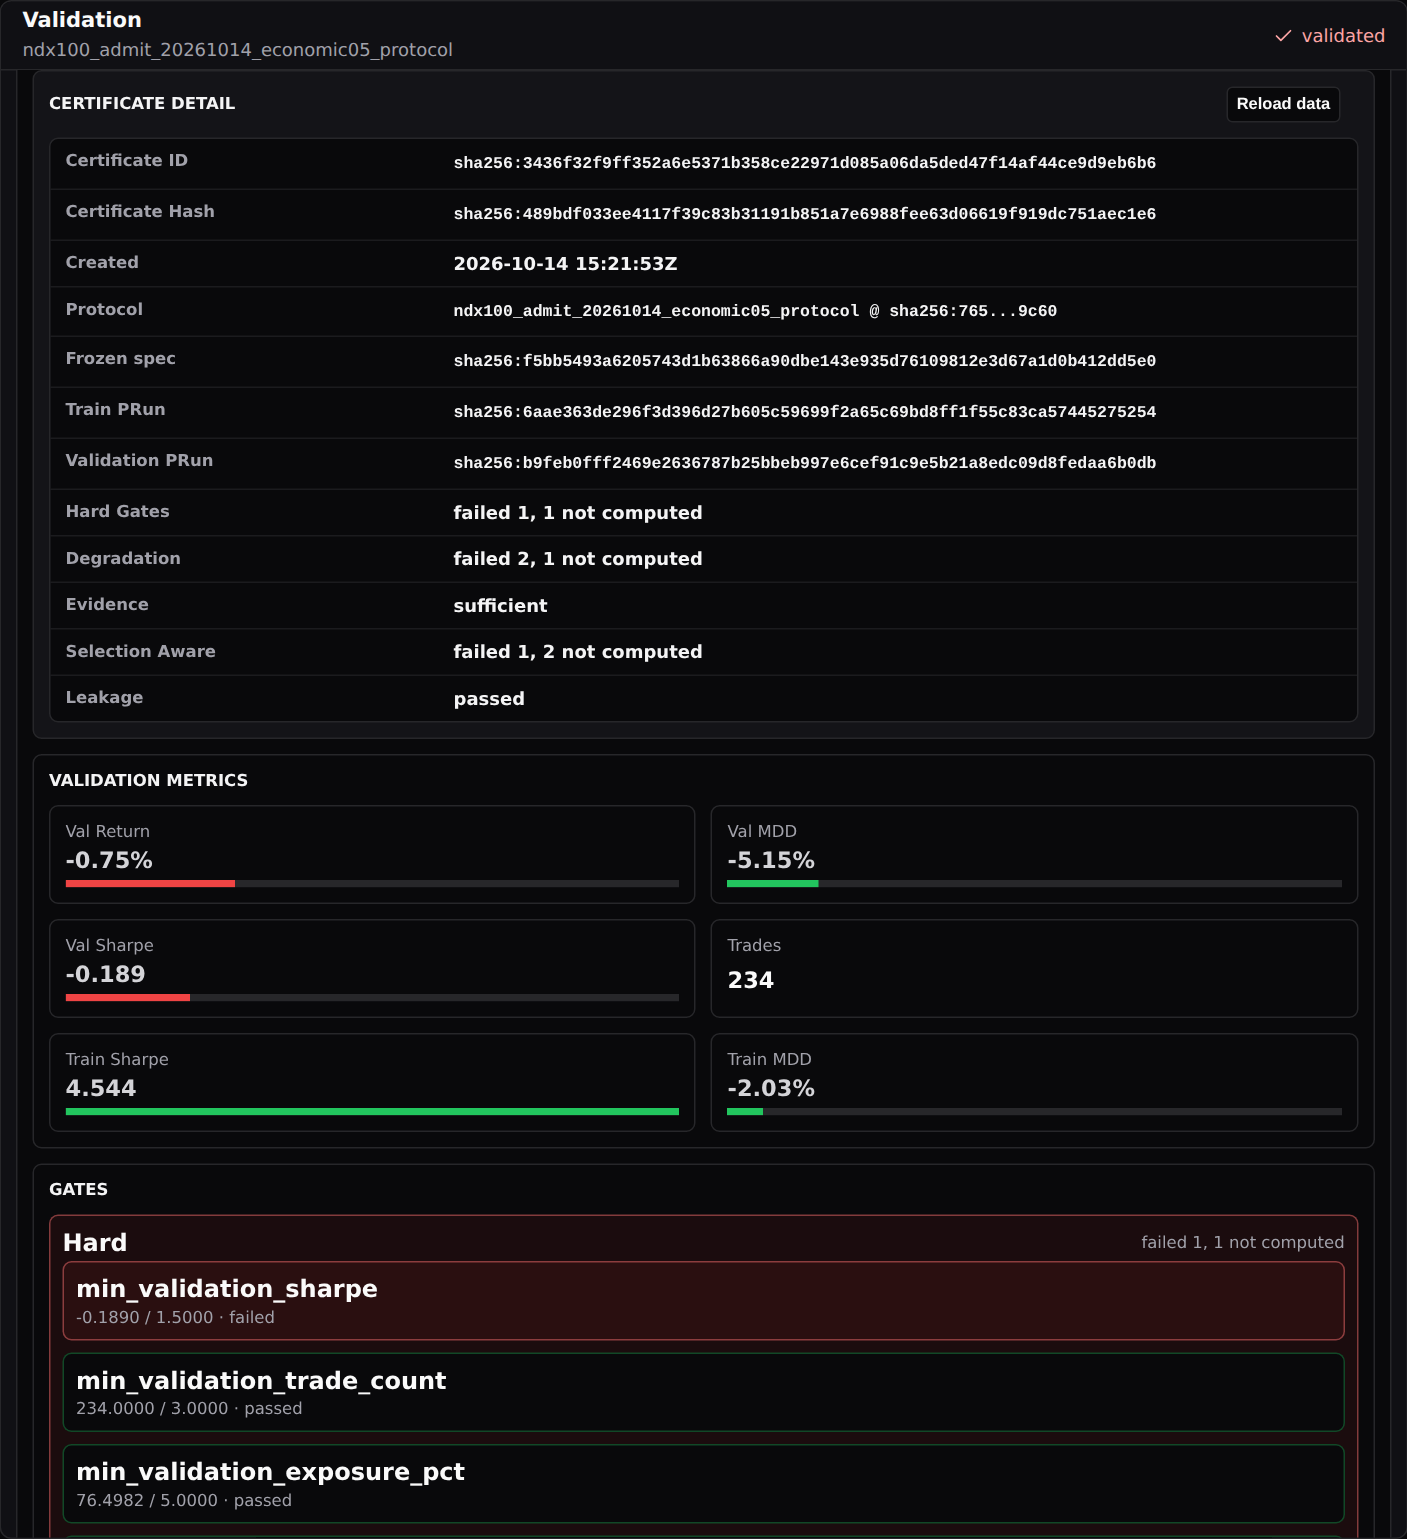
The portfolio failed final validation, returning −0.75% with a Sharpe ratio of −0.189.
View in QBX ↗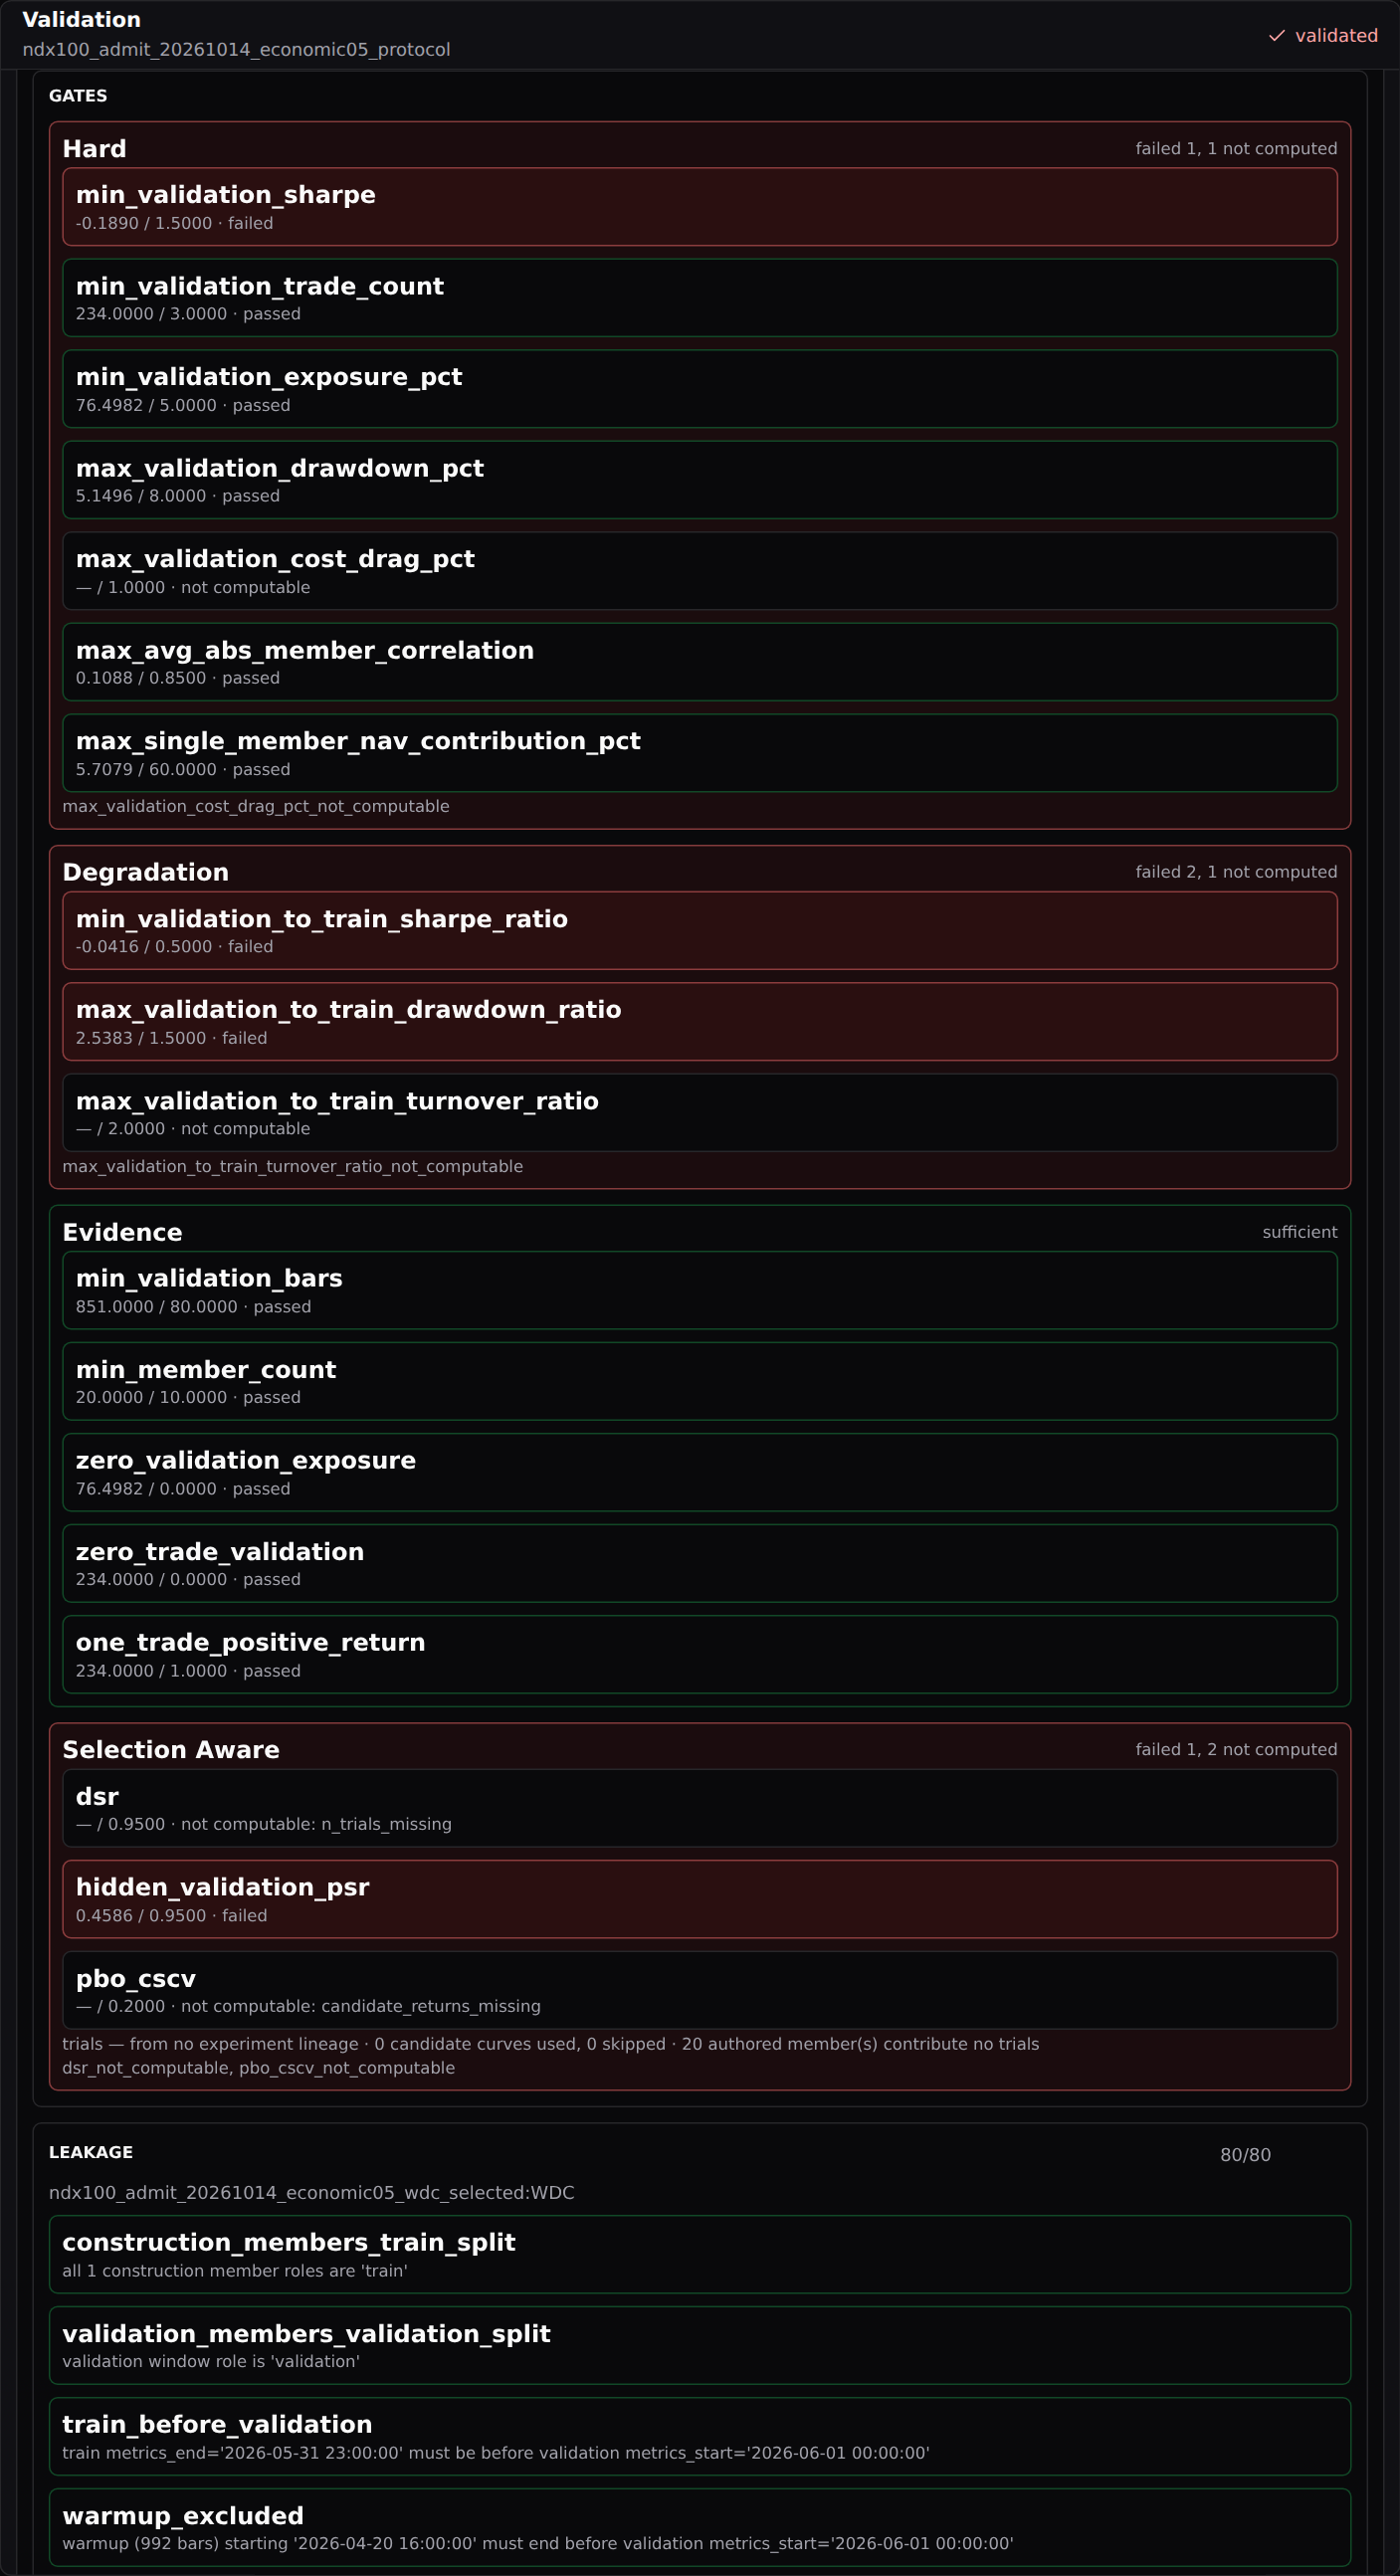
About the research
The signal examples and portfolio study come from separate Nasdaq-100 research projects.
Portfolio charts show the confirmation period. Final validation results are reported in the certificate.